Hackathon by Earth Hacks + Urban Canopy


Let's map the world's

urban heat islands

Sign up to the challenge
What is an urban heat island?

Cities have a lot of asphalt and concrete. This makes them get hot in summer – really hot. Cities can get up to 20 degrees F  hotter than surrounding rural areas. This increase in temperature that cities experience is called an urban heat island. It's a big deal for many reasons, including threats to public health and excessive air conditioning use, leading to even more carbon dioxide emissions. Extreme heat also increases smog, violent crime, and is the cause of more fatalities than any other weather related event. 

Image from Ecostress, NASA JPL, G.Hulley


There's a new thermal sensor on the international space station

In 2017, NASA's Jet Propulsion Laboratory (JPL) sent a sensor up to the International Space Station (ISS) called "EcoStress" that measures the temperature of the Earth's surface, making it perfect for monitoring urban heat in the summer. With temperatures increasing around the world, extreme urban heat is quickly becoming one of the most recognizable symptoms of excess urbanization and global warming, putting thousands of people's lives in danger, exorbitantly increasing the cost of climate-change induced damages, and causing massive CO2 emissions from AC. Our end goal is to help visualize this (in a way that leads to action) and put NASA's images of the world's urban heat islands on a freely available web-based map tool on urbancanopy.io

This is what Ecostress captured in 2019
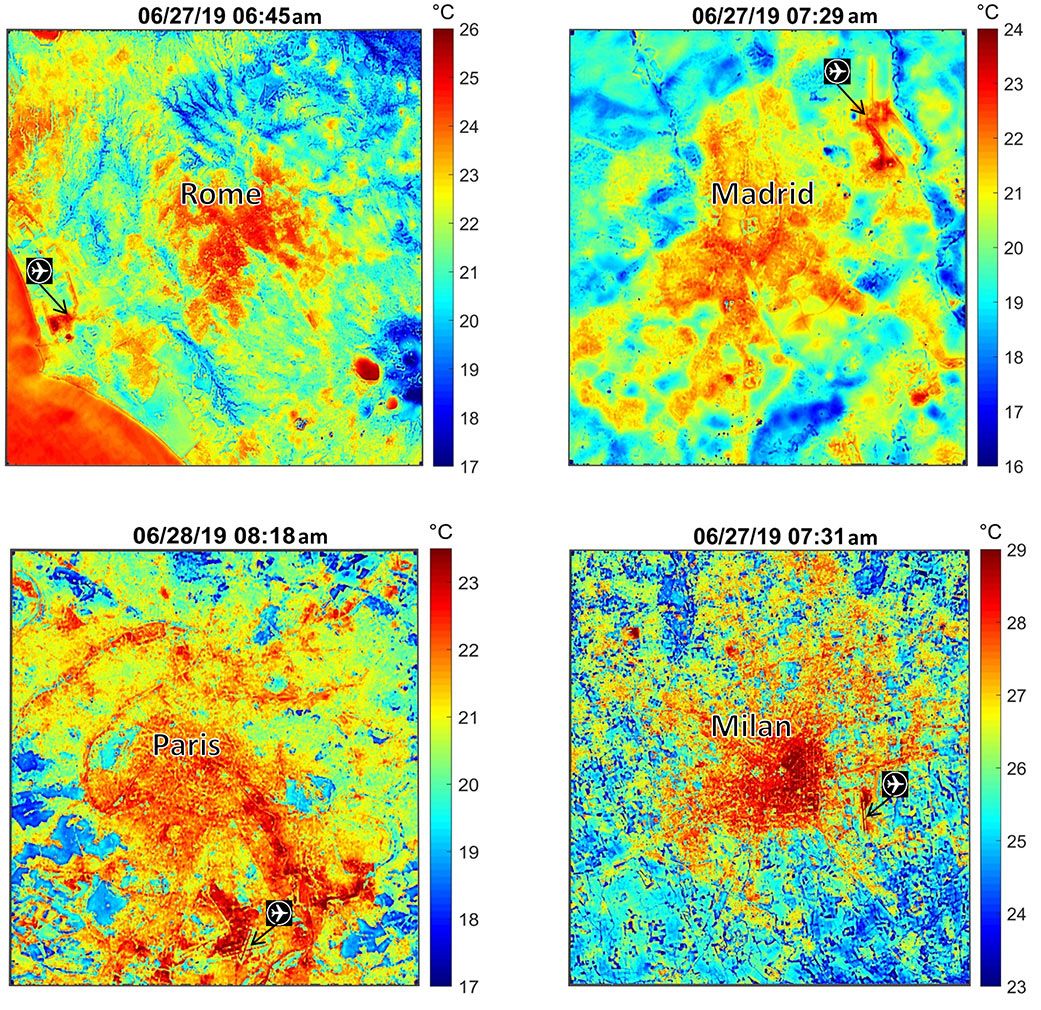
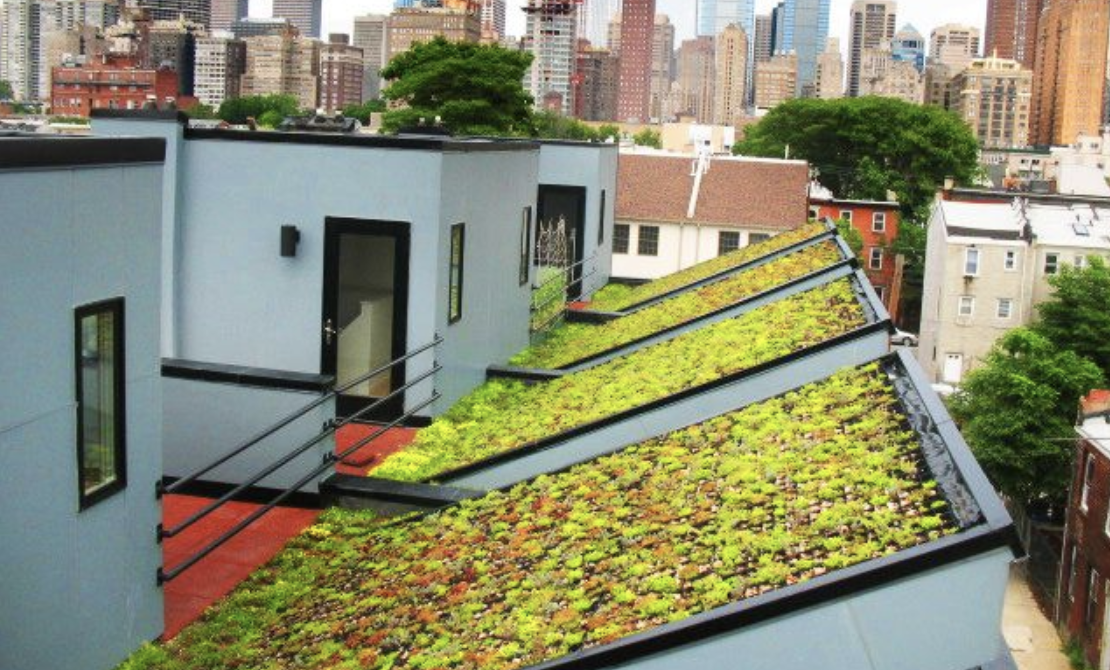
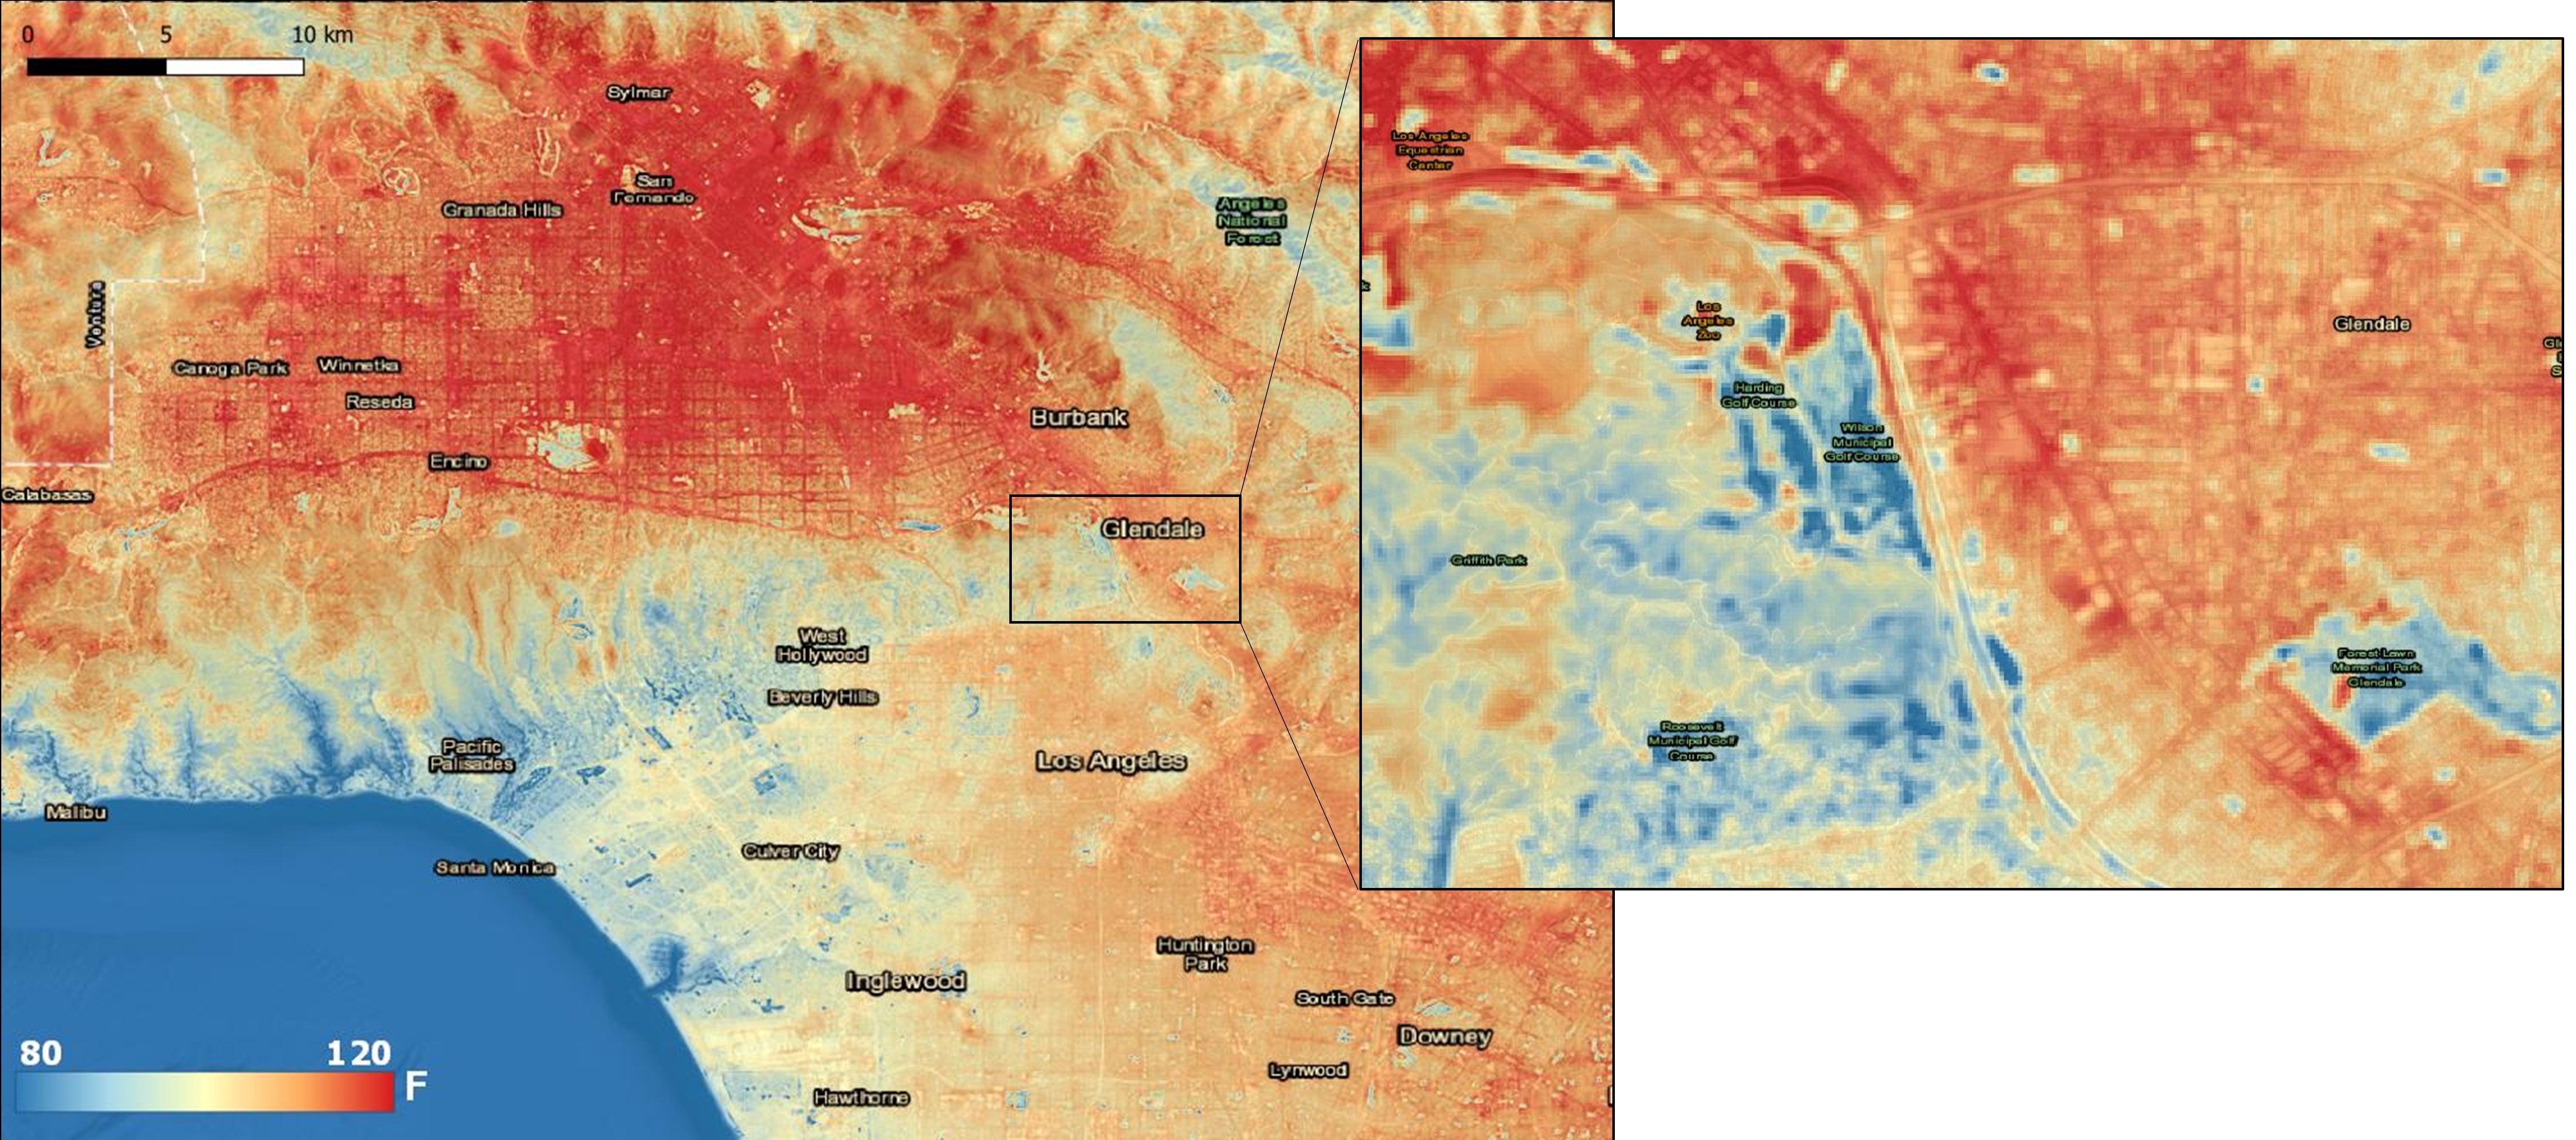
These are images released from NASA in 2019 that show the difference in surface temperature between the middle of a city and the surrounding urbanized areas. Cities can be up to eight degrees (C) hotter than natural areas, with some specific hot surfaces like metal roofs and black asphalt getting over 90 degrees (C).

 Image from Ecostress, NASA JPL, G.Hulley
Let's put it on a map
The current data, shown in these images, is primarily used for scientific reports and it is shown in these JPEG images, but we think it can go further. If we put the thermal data as layers on mapping software like Mapbox.com or in a browser using QGIS, we can use the Ecostress data to show cities, environmental groups, and residents the heat in their neighborhoods. People will be able to search their city and see what it looks like in midsummer thermal colors.

Here's the tutorial we'll be going through during the hackathon.

Like Google's Project Sunroof, but for surface temperature, we can put the data on a map to reveal the hottest properties and buildings in each city, and recommended local actions and tips people can do to cool their properties.


Let's show surface temperature and how each property ranks against the local average.

We're holding an Earth Hacks hackathon 17th & 18th October 2020


Want to get involved? Join us  to help discover and map heat island images taken from space. We'll be holding a weekend long hackathon on Saturday October 17rd and Sunday 18th. If you love working on this project, interested participants can continue for the next 12 months. The EcoStress sensor is continually imaging the Earth, so there are always new urban heat islands images to discover and map! Learn more about Earth Hacks here.

Your image could be chosen to be featured on the NASA JPL ECOSTRESS image gallery! Start getting to know people already working on this data by joining the ECOSTRESS Slack Channel. 


Sign Up
Summer heat causes a severe spike in peak electricity and emissions
 The load on the electricity grid in many cities doubles during summer because of increased use of air conditioning. The peak electricity is usually made up from more polluting forms of gas power stations known as "peaker plants." Urban Canopy's mission is to reduce the peak demand on the grid during summer.
Extreme urban heat causes a lot of problems
Let's work out the (literally)hottest and coolest commercial properties in each city
The great thing about high-resolution environmental data is that we can use it to drive behavior change. People can get very motivated to change when they see how  their score compares to others. With the EcoStress data and programs like QGIS and Mapbox, we can work out the average surface temperature of each property in a city and create an index of the hottest, and coolest properties, and use this index to playfully nudge  businesses to improve their score by putting in a green roof or planting shade trees.
Using thermal maps to drive urban greening and cooling action
 There are many things we do to prevent extreme urban heat. We think that the novel thermal images will motivate people to take action, and the site members are directed to local partners who provide products  energy efficiency and greening such as energy efficiency appliances, roof insulation, reflective paints, shading trellises, trees, green roofs, and window shades.
Plant a tree
Connect to local tree groups and nurseries.
Paint your roof white
Get deals from local contractors and roof coating suppliers.
Create a mini-park
Find some concrete to remove and turn into a mini-park.
Install a cool roof 
Find local suppliers and quotes for a cool roof.
Switch to an efficiency AC
Find the best energy saving AC near you. 
Personal cooling devices
Find non-ac ways to cool with desk fans, cooling scarfs,  and sprayers.
Shading
Learn how to shade car parks, walls, and windows.
Green roofs & green walls
Find products and experts to help you install a green roof or green wall. 
[bot_catcher]