
How to map your urban heat island
Your mission is to make the world's urban heat islands visible in high resolution on a publicly available map. Your quest for this hackathon is to discover images of urban heat islands from within the EcoStress data set (available on the NASA website), process the images using QGIS, and apply the data to a Mapbox app that will be visible on a web browser. Your work will be added to a tool similar to Google's Project Sunroof, where people can look up any property and see their heat island score. Read up more at: EcoStress technical information, Top 10 US cities with urban heat islands, UHI Wikipedia page, and 27 ways to protect your city, home and self from extreme heatwaves.
The hackathon process has three phases:
Search, Process, and Map
To build the urban heat island map, you'll go through three phases. The first phase is to discover an appropriate image of an urban heat island for the city you are working on in the EcoStress archive. The second phase is to open the image in QGIS and run calculations, adjust the colors, and potentially trim the image. The third phase is to export the map from QGIS in the form of a Mapbox raster tile file, and import that file into Mapbox. You can set up your own Mapbox account and experiment with Mapbox's powerful design kit, and also save the raster tile file into the Urban Canopy Google drive and we will upload your city to the master world map with all the other cities. Once you have a nice heat island map, you might like to experiment with an advanced challenge to analyze tree cover, albedo, image sharpening, or creating communications or designs to help tell the story of urban heat.

PHASE 1:
SEARCH FOR YOUR IMAGE
The hunt is on! In this phase, we'll be hunting for an appropriate image of an urban heat island for the city you are working on in the EcoStress archive.
Step 1.1: Identify the city you'll work on
Choose a continent or country to focus on. This will be your target region for your team where you will search for, and plot the urban heat islands you find.
Look out for cities in the North America, Europe, and Asia that experience hot summers.
Hackathon attendees will be grouped by location - try not to double up and do the same city twice!
Here is a list of good cities to form a group around:
United States
California: San Jose, Los Angeles, Fresno, San Luis Obispo, Palm Springs, San Diego, Central Valley, Bakersfield, Oakland, Sacramento.
Oregon: Portland.
Washington: Seattle.
New Mexico: Santa Fe, Albuquerque.
Arizona: Phoenix, Tuscon.
Utah: Salt Lake City.
Colorado: Denver.
Illinois: Chicago.
Texas: Houston, Dallas/Fort Worth, Austin, San Antonio.
Georgia: Atlanta.
Ohio: Columbus.
Minnesota: Minneapolis.
Kentucky: Louisville.
Oklahoma: Oklahoma City.
Virginia: Richmond.
Missouri: Kansas City, St Louis.
DC: Washington.
North Carolina: Charlotte.
Nevada: Vegas, Reno.
Florida: Jacksonville, Orlando, Tampa, Miami.
Pennsylvania: Philadelphia, Pittsburg
New York: New York City.
This is just a starter list. feel free to chose another city not mentioned here. Small cities are great, too! This list covers large cities, but smaller cities such as Fresno, California, still suffer extreme heat caused by urbanization. ECOSTRESS captures all of the USA, most of Europe, but may have less data for other cities around the world.
The ECOSTRESS project has a key interest in the following cities:
Los Angeles |
Phoenix |
Chicago |
New York |
Washington DC |
Sao Paulo |
Athens. |
London |
Paris |
Beijing |
Melbourne |
Buenos Aires |
Johannesburg |
Tokyo |
Mumbai |
Step 1.2: Find a land surface temperature image on the ECOSTRESS gmap search
Go to the EcoStress image browsing page called "gmap" at https://ecostress.jpl.nasa.gov/gmap/
Click on the small grey button that says "Go to Map" or access it here https://ecostress.jpl.nasa.gov/gmap/eco_map2
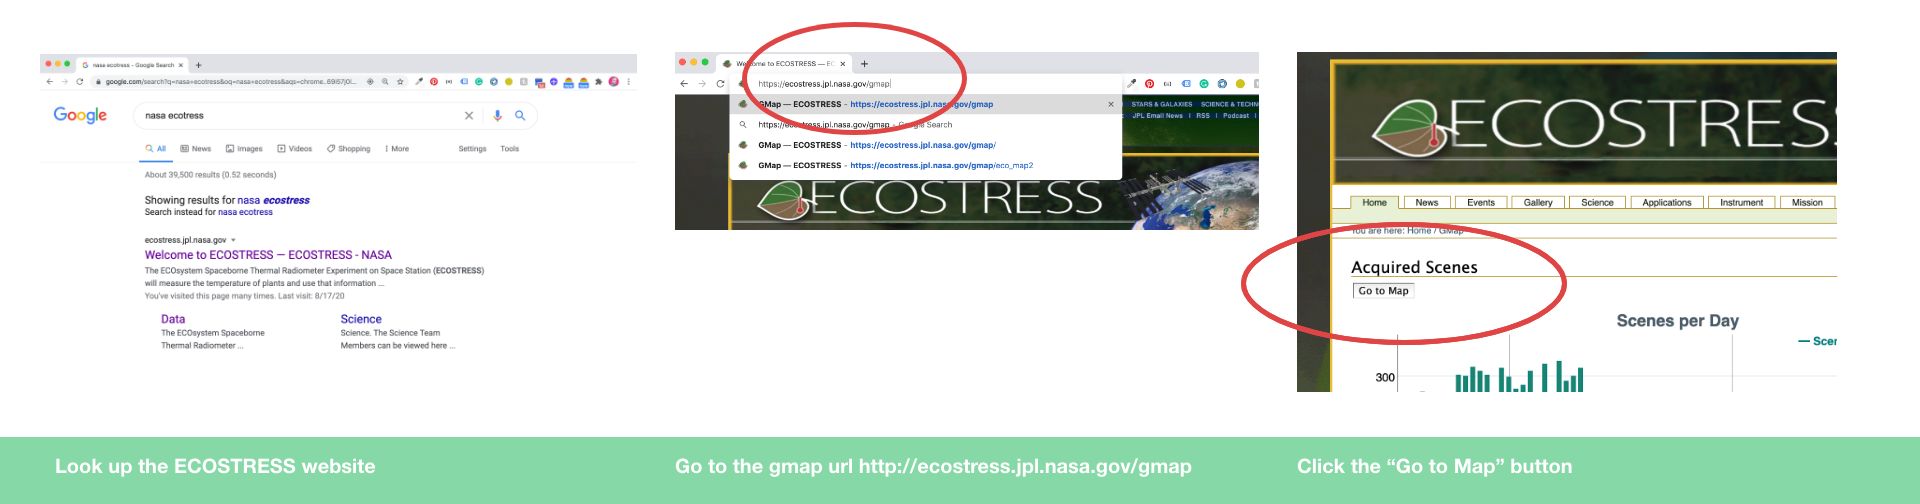
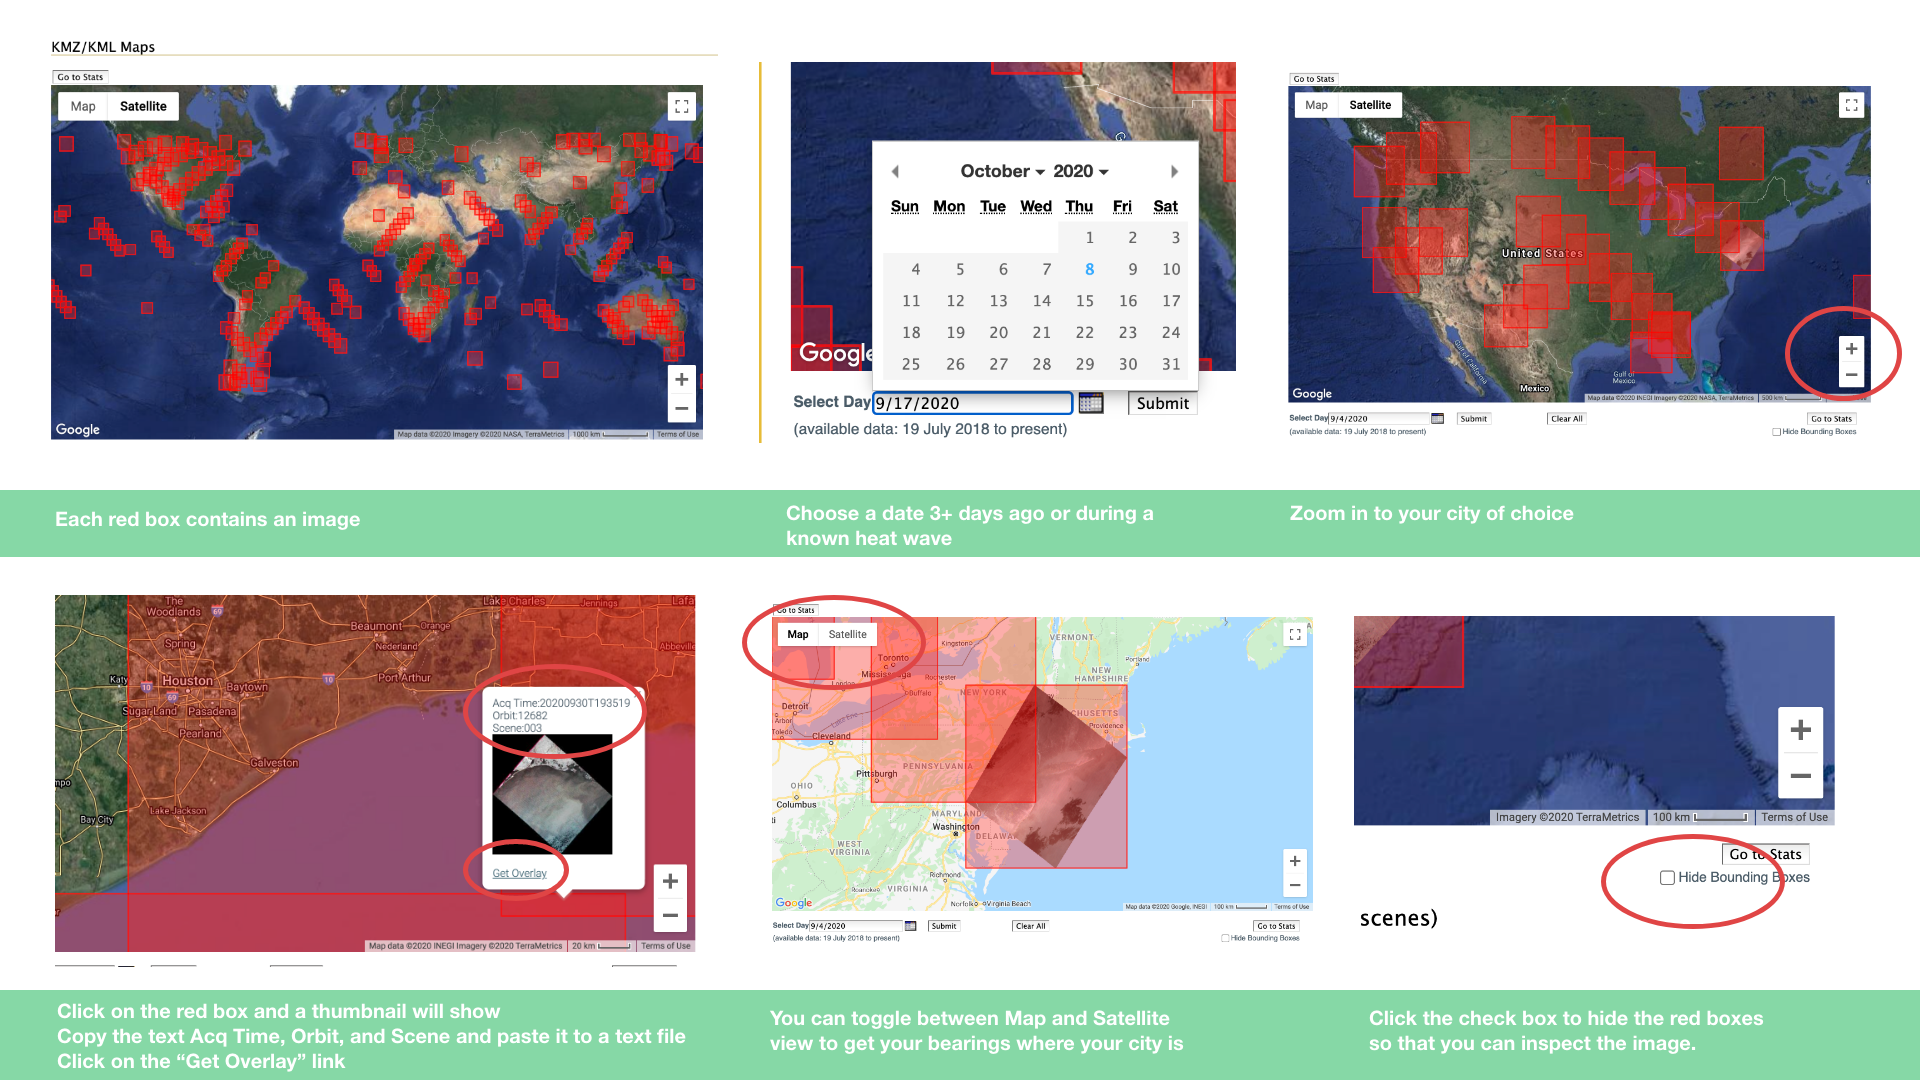
You'll see a world map with lots of red squares. Each square is an ECOSTRESS image that is available. This map is showing you the most recent images for today or yesterday. Images for the last 3 days may not be available to download. Click on the calendar on the lower left of the world map and select a day more than three days ago, and click the small grey button "submit" next to the calendar.
The world map with the red boxes should re load with data for the day you picked on the calendar.
Zoom in to your city and see if there are red squares over your city.
If there is a red square covering your target city, click it, and a small thumbnail of the image will open in a pop up.
Copy the text above the thumbnail that says Acq Time:20200929T215616, Orbit:12668 Scene:005 and paste it somewhere that you can check later.
Click on the "Get overlay" link on the thumbnail. It will place the thumbnail over the world map.
Click the checkmark on the lower right hand side below the map that says "Hide Bounding Boxes" - it will take away the red boxes so you can see the image.
The image will be greyscale. You'll add color grading in phase 2.
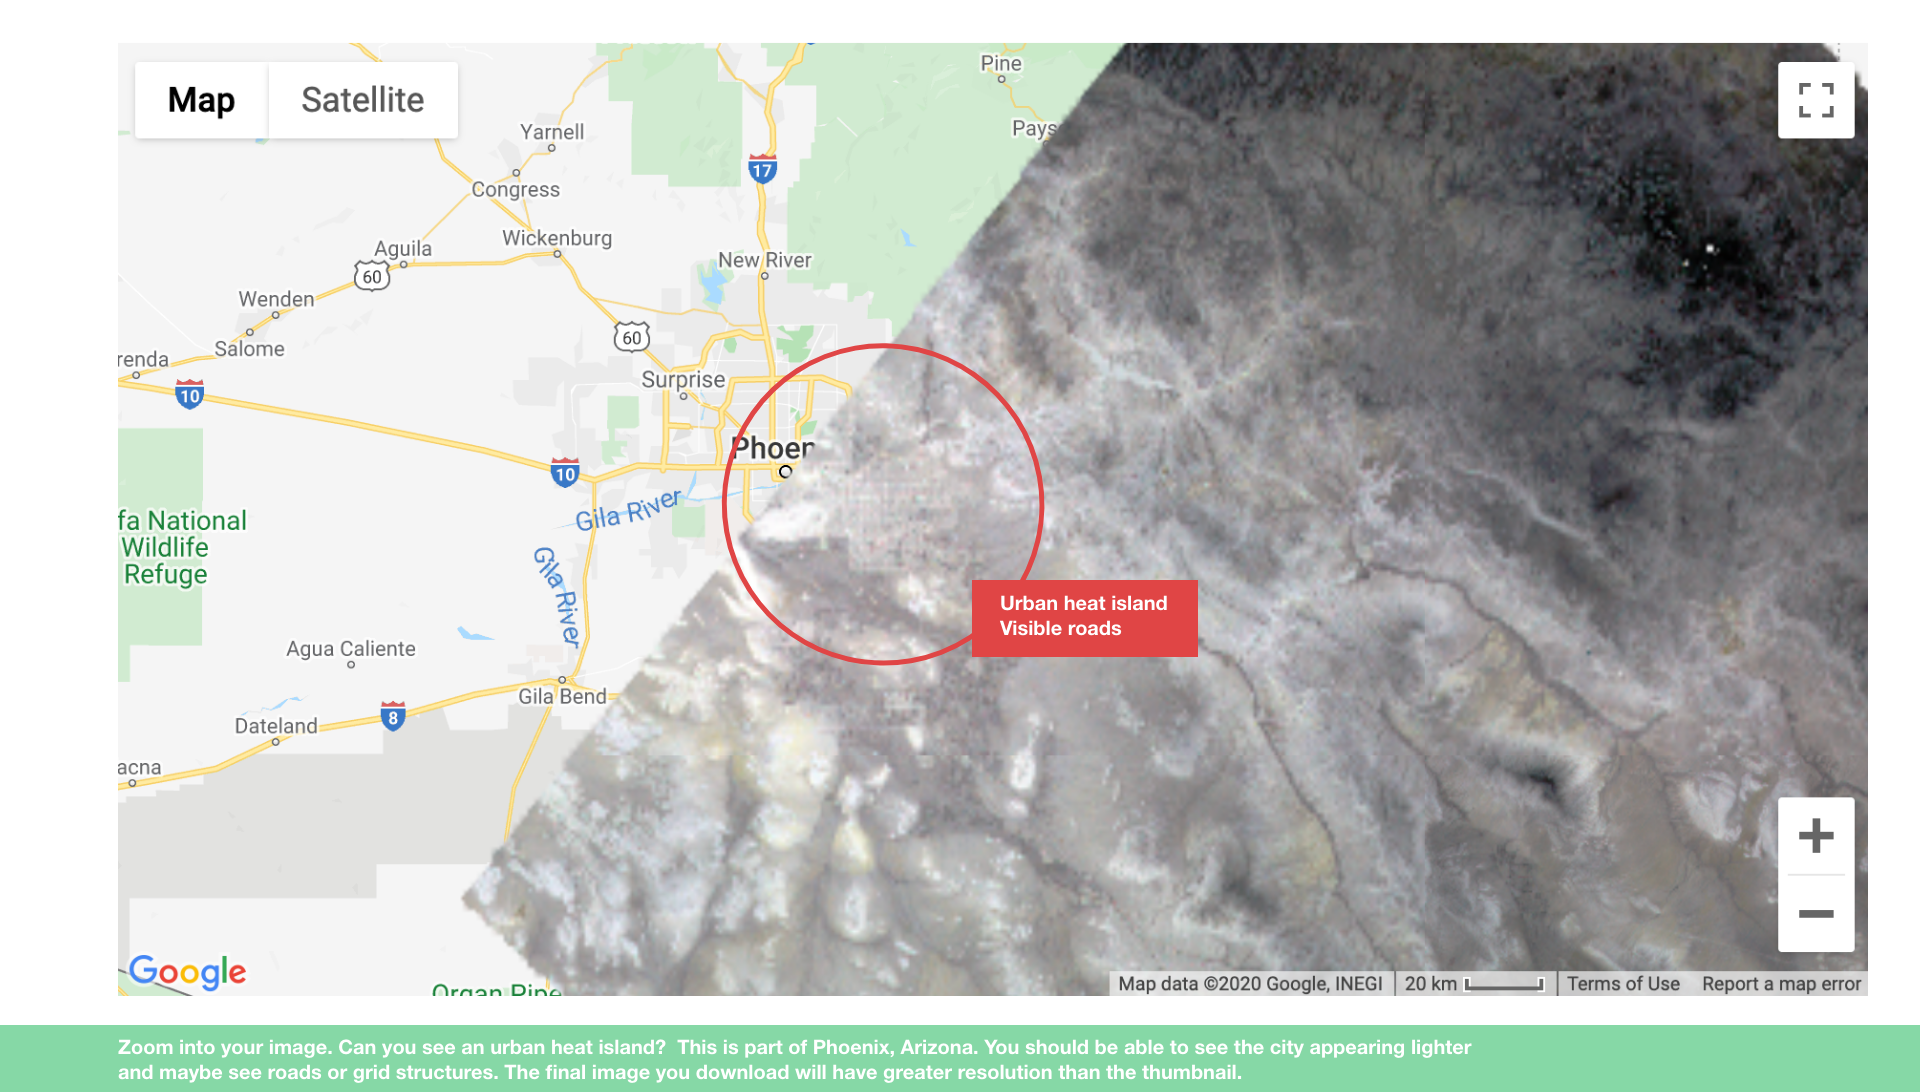
Toggle between the map and satellite view to get your bearings of where the city is. You can always reload the page. You want to be able to see what looks like a city and an urban heat island. They can be small, so zoom in and look closely.
The ECOSTRESS image will be a different size to the red square and may not cover the city you are looking for. No problem. Just choose another day back.
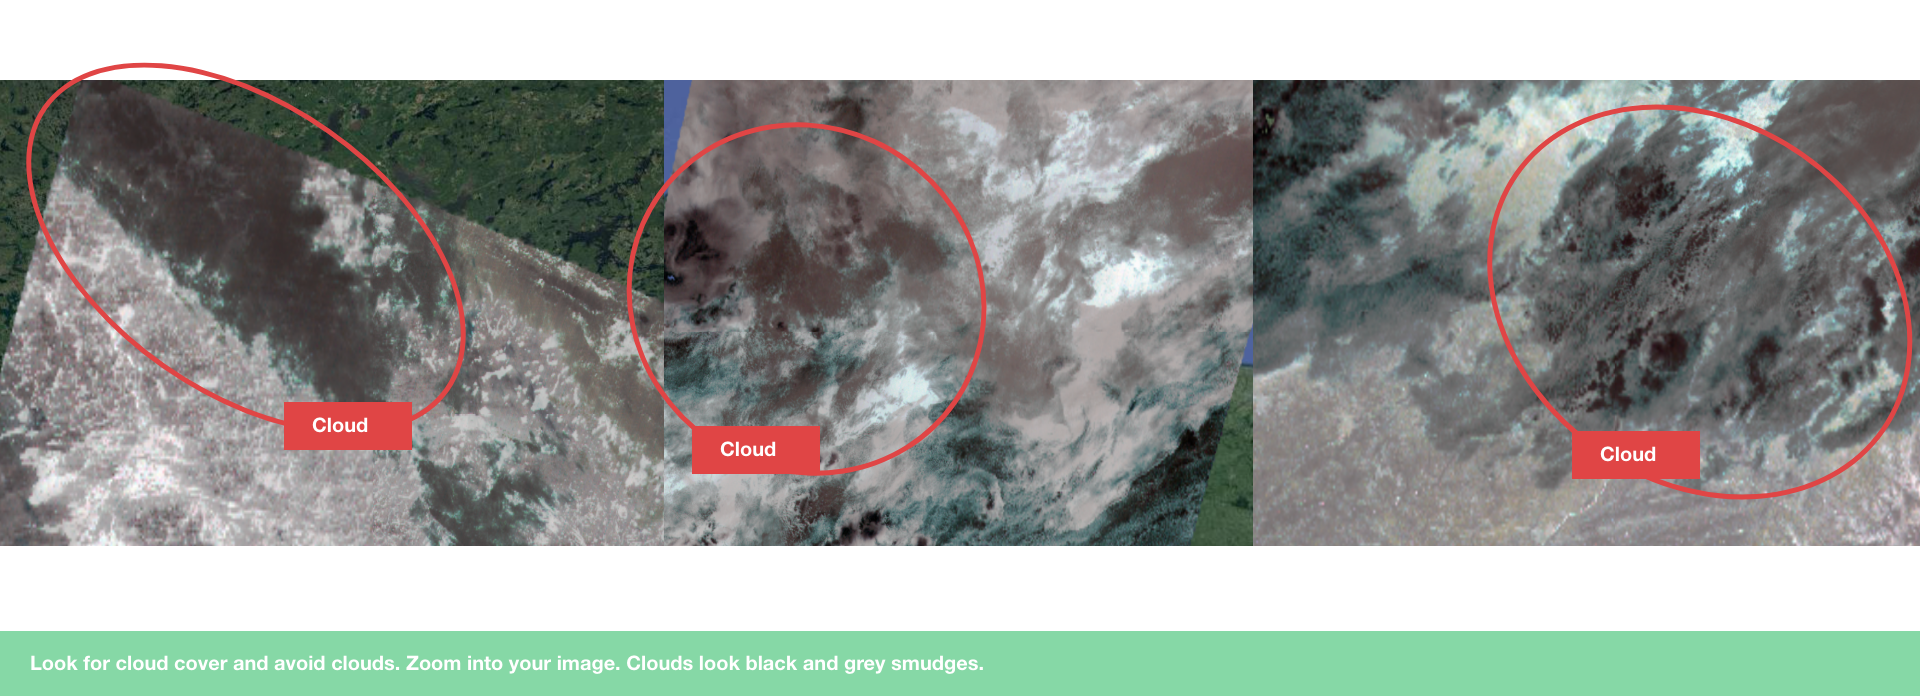
Zoom in to see if it looks like you can see the city. Clouds will look like a dark blur. Avoid all cloud images. Any cloud covering the city area will make the image not viable for this project.
If there are no red squares over your city of choice, go back the calendar and chose the next day back and and see if red boxes show up. If there still is no red box showing, keep changing the day in the calendar each day until you find an image. ECOSTRESS covers each city in the USA and Europe approximately once a week so you should expect to have to look up several days before you get an image covering your city.
Your task is to browse through each day for September and August to make a shortlist of images covering your target city. You may end up with 3 - 10 images to chose from that were captured during summer months.
You'll need to repeat this process up to 60 times for each day through August and September 2020. If you find a really clear image from a hot day at the perfect time of day, there's no need to keep searching.
As there may require searching over 60+ days, try to split up your team to search for different weeks. One person might take the first week in August, and the next person might search the second week in August, and so on.
You can look through each day on gmap, then check the images you find against the daily high temperature on weather underground. Or you can look for clear days and heat waves on weather underground. It might worth noting overcast days to avoid searching for those days.
**The purpose of this step isn't to download the images. It is to browse the images visually in order to find the right day that has a good quality image that covers the city of choice at the right time of day, and is clear of cloud cover. You will download your image later via another website called AppEEARS.
Urban heat islands occur only under specific conditions.
Your image should:
1. Show the full urban area and including the entire city you are focusing on. If you get an image that only gets part of the city, keep looking for another image that gets the city.
2. If in the northern hemisphere, be for July, August, or September 2020. If in the southern hemisphere, be from December, January or February 2020.
3. Be taken between 2pm and 11pm local time (no morning images - we want to see how hot the city gets). The ideal time of capture is between 4pm and 10pm. Don't forget that the time on the image is in universal (UTC)/Greenwich time, so you will need to convert that to the time in the image's location. Urban heat is best viewed on early evening images - they show the greatest thermal contrast because the vegetation cools down and the roads remain hot.
4. Avoid cloud cover over the urban area (Clouds look like black spots or streaks).
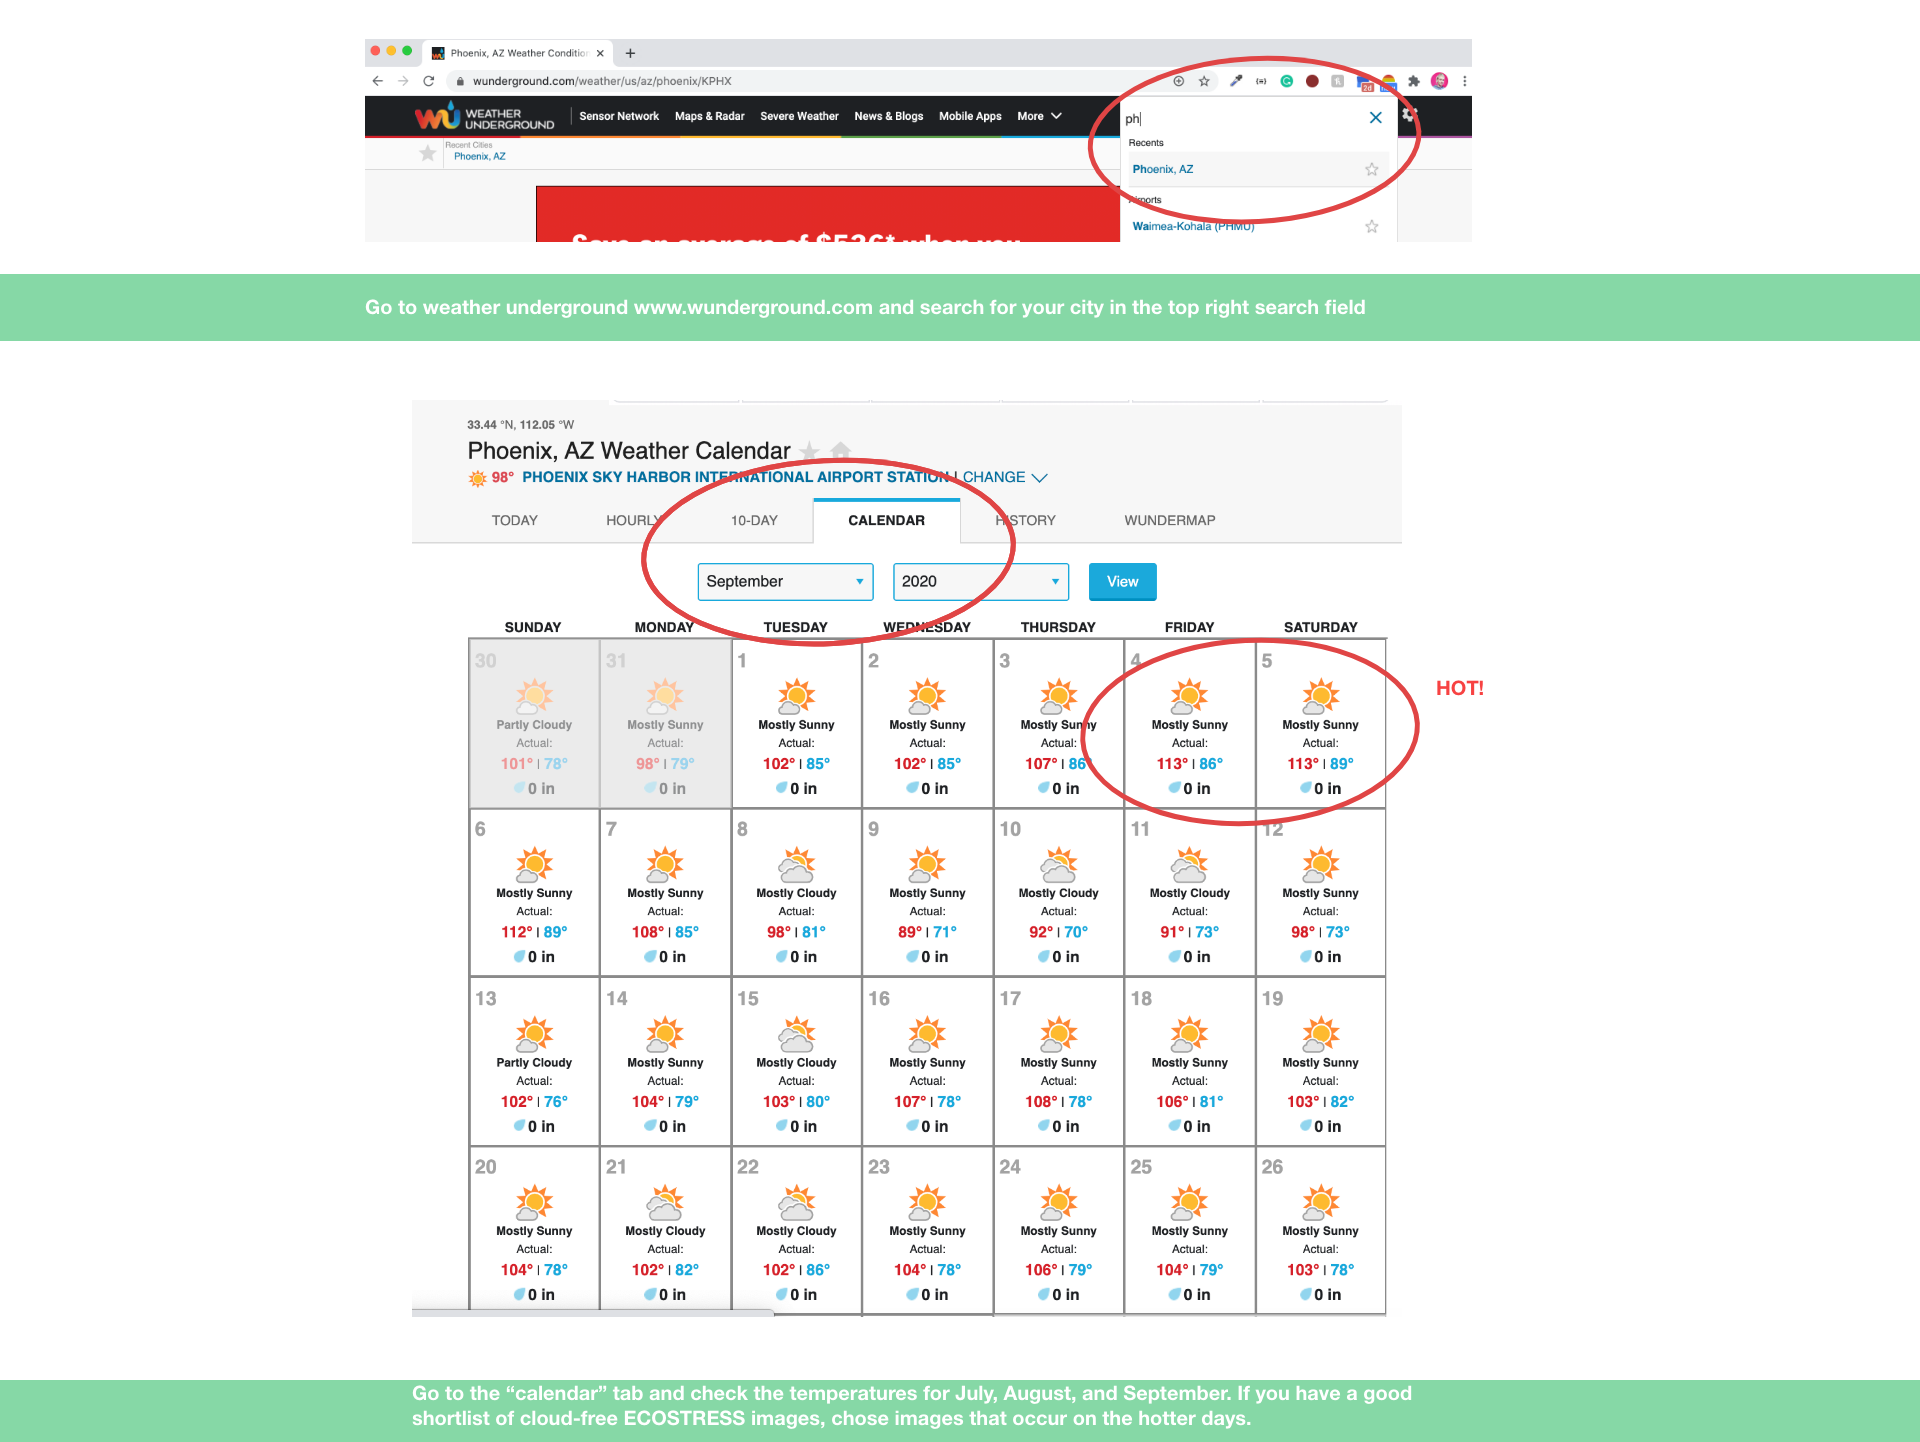
Step 1.3: Check the historical air temperature for hot days
Now you should have several potential images to use. You want to chose the one from the highest temperature days. Look up Weather Underground, search for the city you are working on and look through the days that you have viable images through August and September. Choose an ECOSTRESS image to use that occurs on a hot day.
Step 1.4: Download the geotiff file from AppEEARS
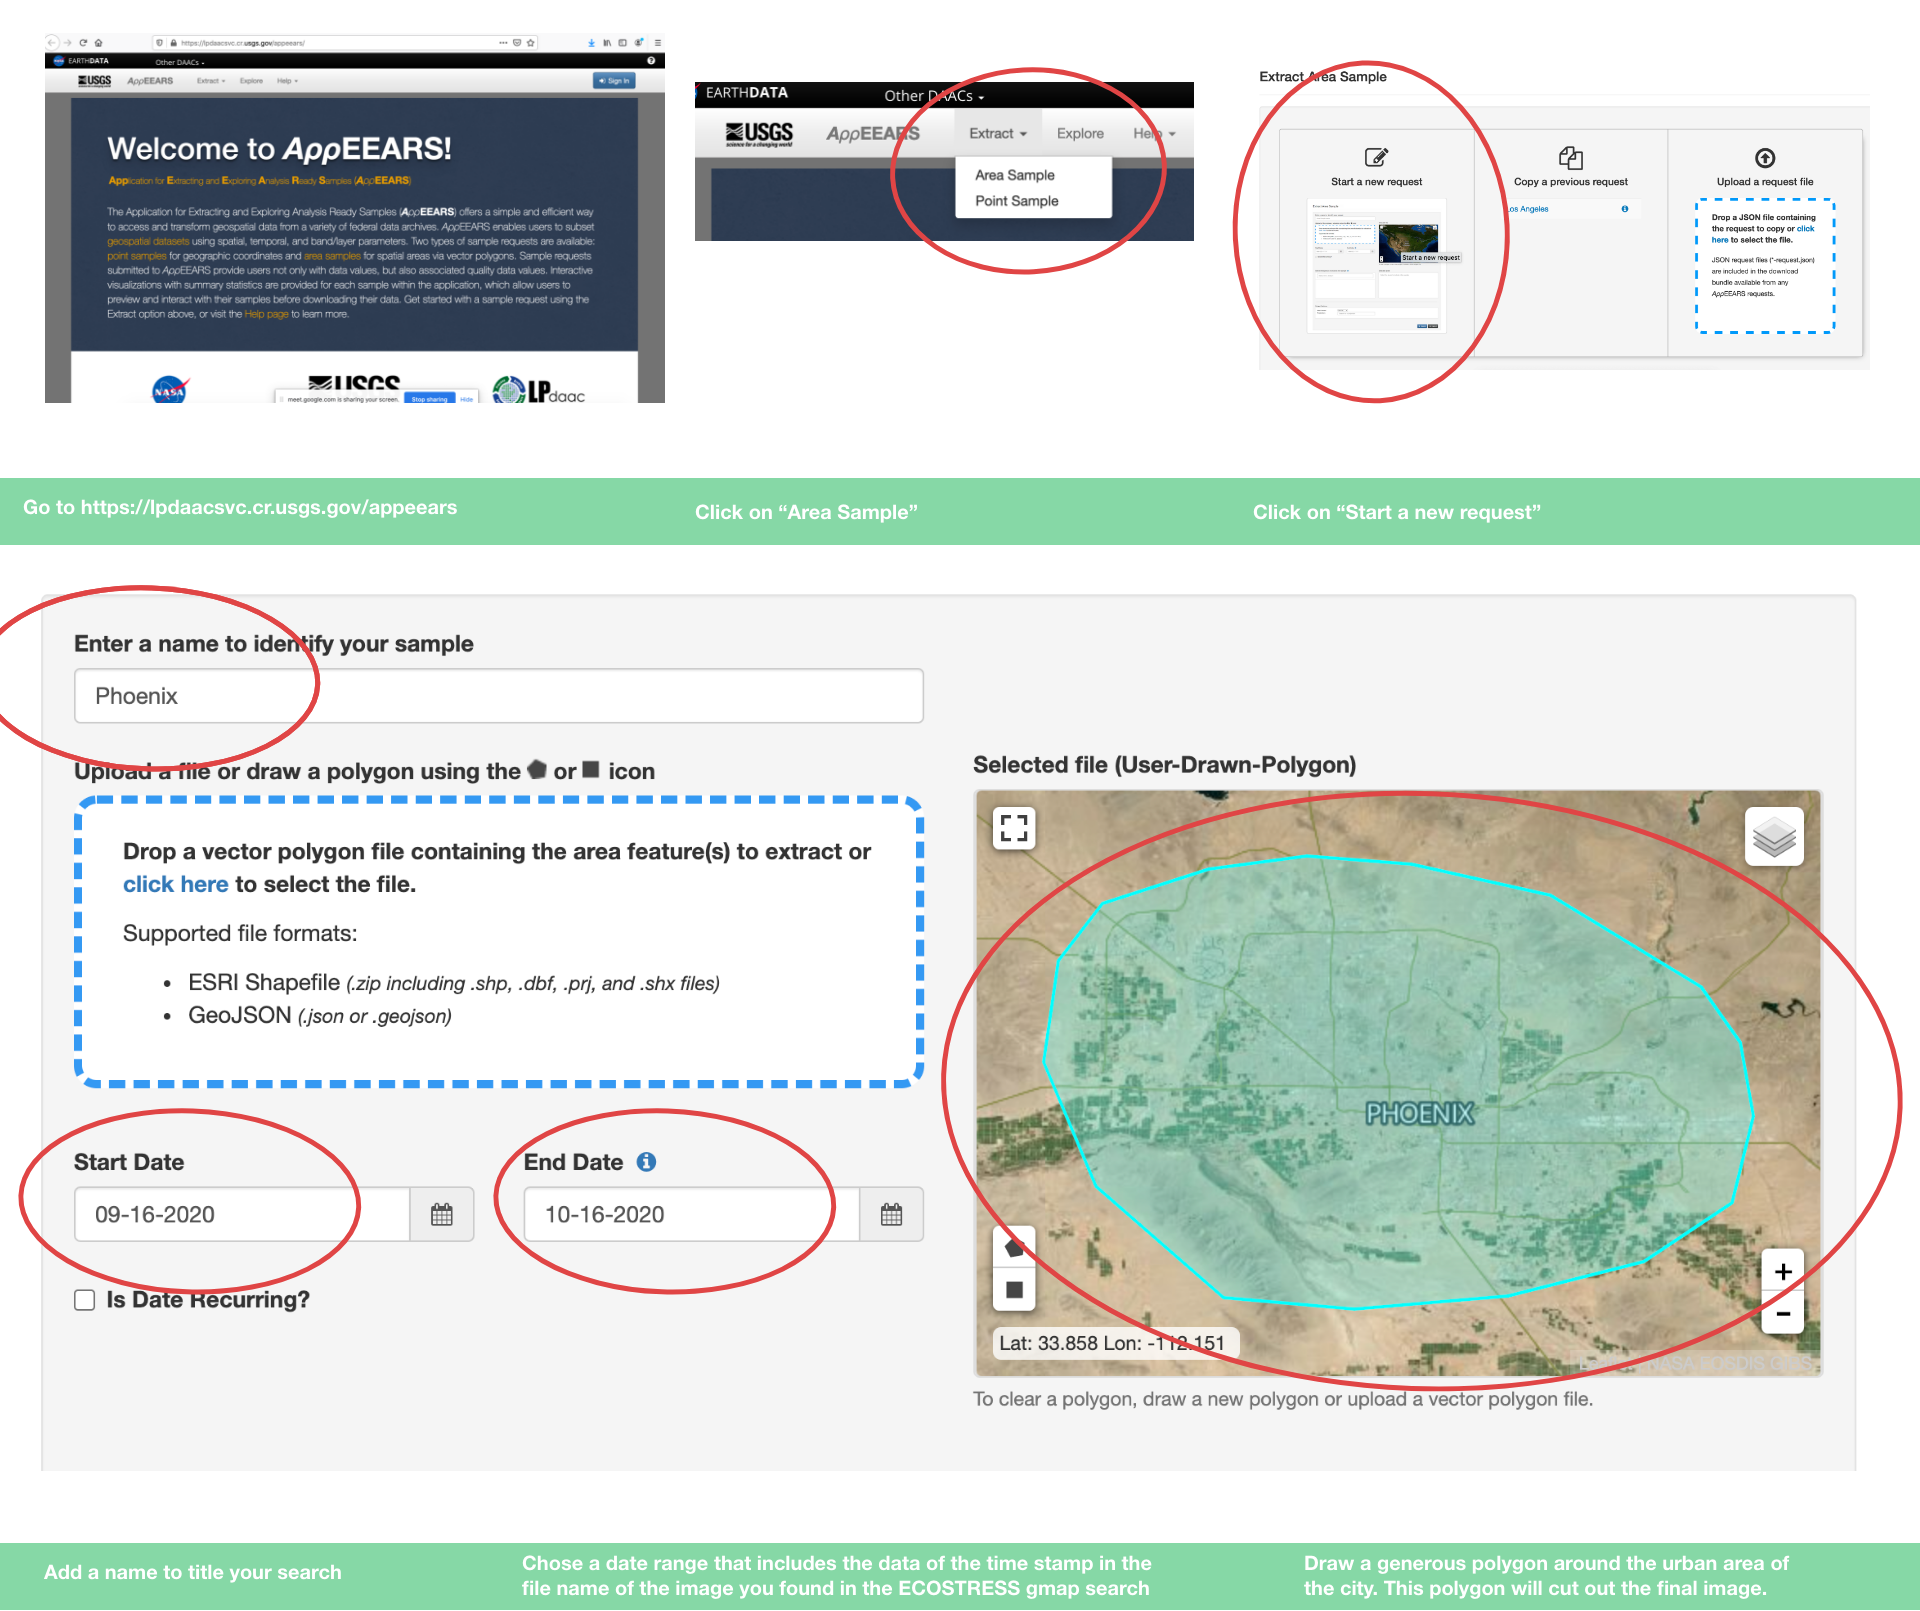
Go to https://lpdaacsvc.cr.usgs.gov/appeears/ to now search for your images where you'll be able to download them.
You'll beed to create a username and password.
Go to "Extract > Area Sample" from the top van bar.
Click on the large button on the left called "Start a new request"
A page will come up where you can add search parameters.
Add a name that you will call the search.
Add a date range that covers the time when your desired ECOSTRESS image would have been taken. You'll need to determine the date that the image was taken by looking at the date code on the file name. That's the number on the thumbnail from before you needed to copy and paste into a text file. Read the section below "decoding the image file name" to figure out what date is was taken and then select a day before and day after on the search.
You'll need to draw a polygon around the area you want the image to cover. The line you draw will cut out this section of the raw Ecostress image (the original images can be up to 500 miles long) so be careful to select a wide area, but also not so wide that you end up with loads of desert or farmland. You'll want to generously capture the city with some surrounding area to show the temperature comparison. You can trim the image size down later in QGIS.
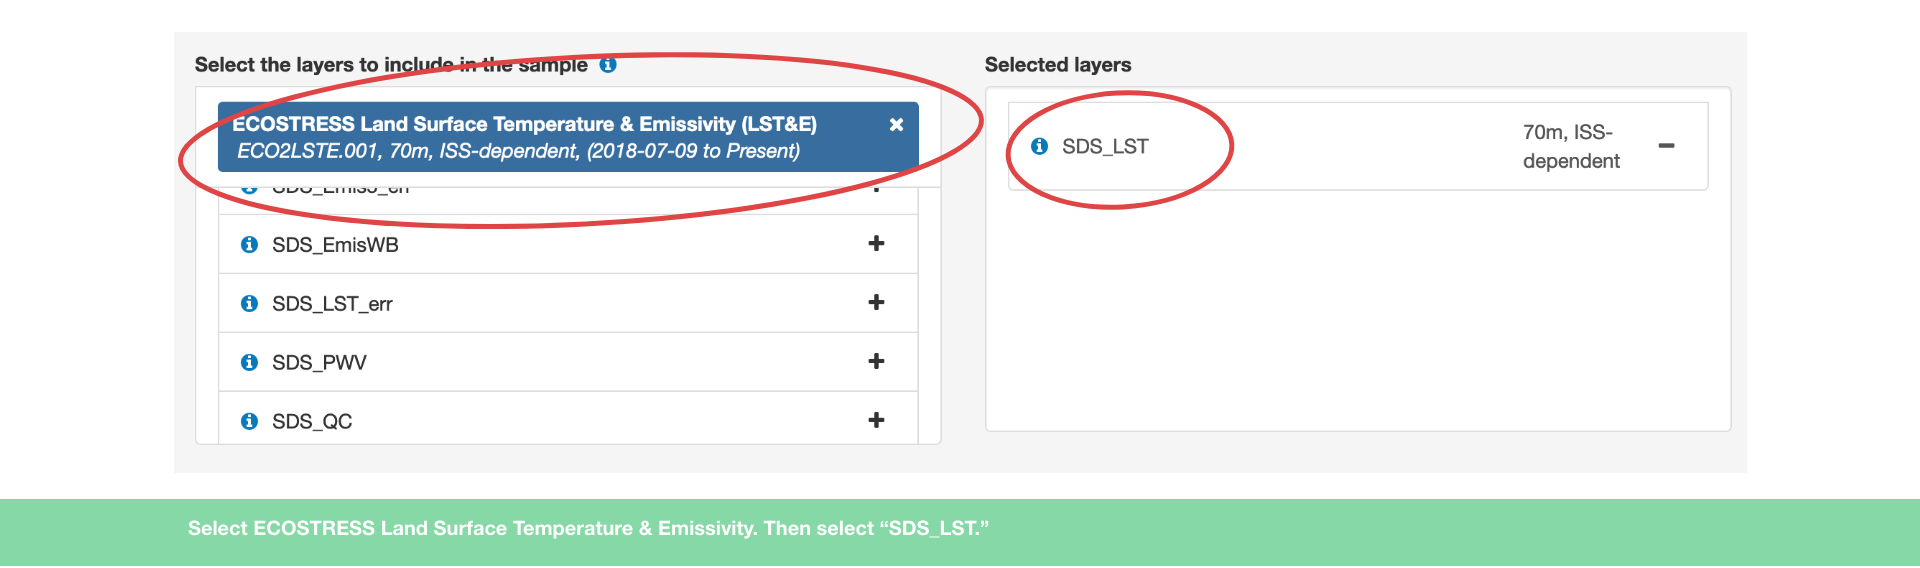
In the field "Select the layers to include in the sample" type in "Ecostress" and chose the dropdown called "Ecostress Land Surface Temperature and Emissivity (LST&E)."
On the next panel underneath, select "SDS_LST."
On the "Output options" on the next panel, select "native projection."
Click the submit button.
THEN WE WAIT
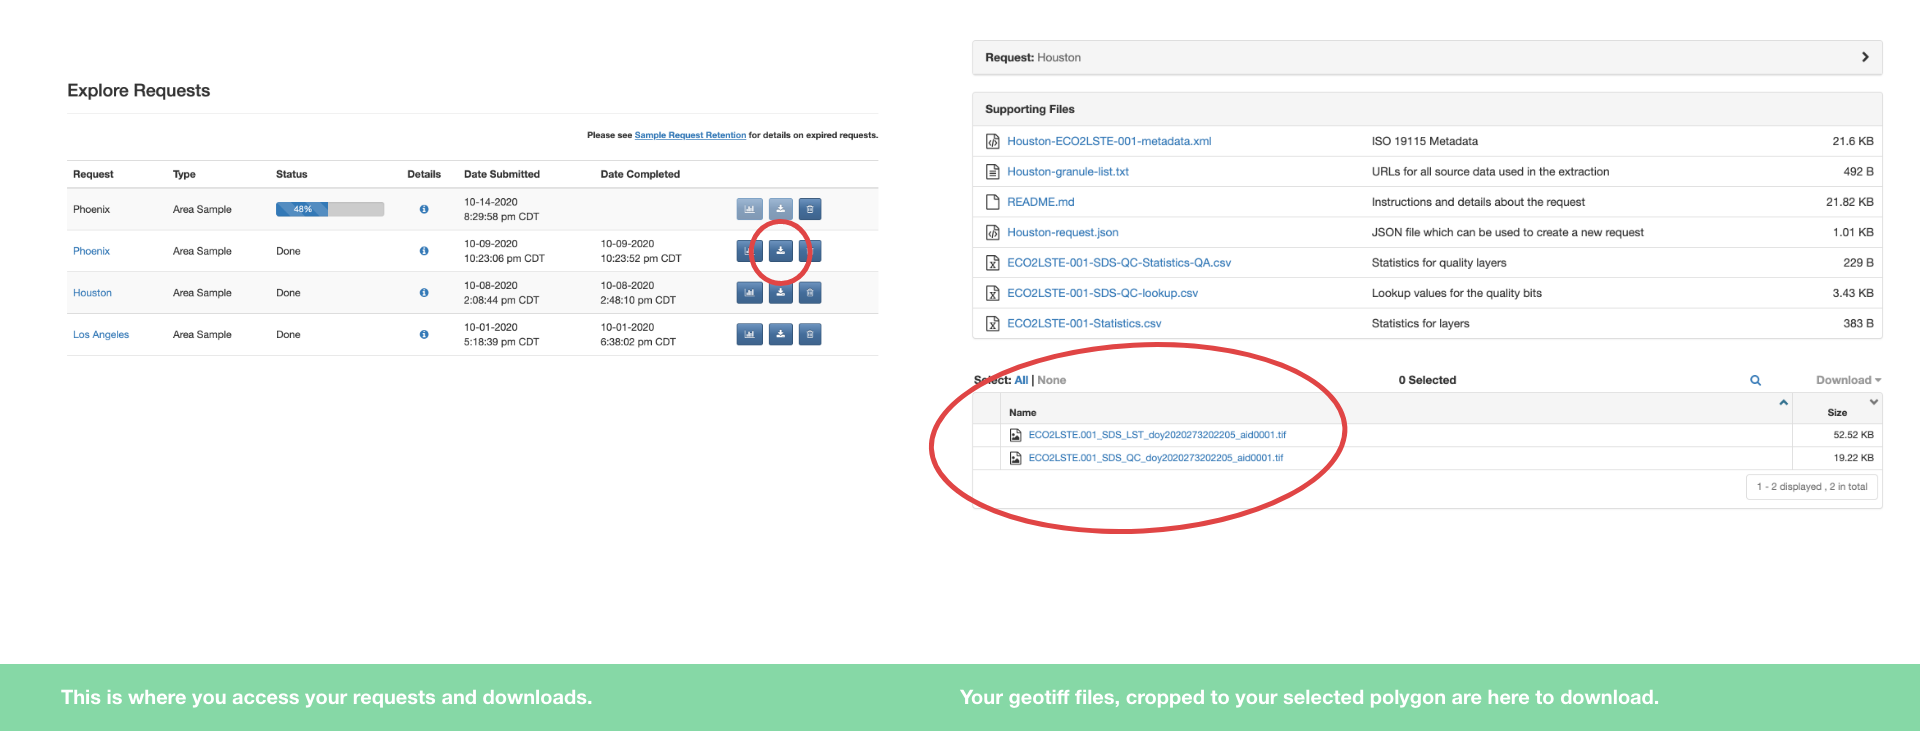
Your request will call the NASA servers to send you the image. This can take 1 - 3 hours. You'll get an email when you search is complete and the geotiff is ready to download.
You may get back many images. You may get a couple, or if you made a mistake in the search, you'll get none and need to start over or widen the date range.
You can check on the status of your image request at the "Explore" button on the top nav https://lpdaacsvc.cr.usgs.gov/appeears/explore and you'll always be able to access your historical image queries from this page.
Decoding the image filename
The file names you see on the ECOSTRESS gmap and the downloads you'll get from AppEEARS will have a file name with a lot of numbers. These numbers are a time stamp that identify the time that image is taken and also make up its unique ID.
ECO2LSTE.001_SDS_LST_doy2020266010103_aid0001.tif
This is how the number in the file name works:
2020 266 0101 03 -> year, the day of the year, greenwich mean time hours and minutes, seconds.
2020 -> the year 2020
266 -> the 266th day of the year (from the 1st January)
0101 -> 01:01 Greenwich mean time (you'll need to convert to your city's local time)
03 -> seconds
Step 1.5: Save copies of your geotiff downloads to the Urban Canopy Google Drive
Once you have a short selection of geotiffs of your city, make sure you save a copy of files into the Urban Canopy Google Drive. Keep the file name the same, just put it in a folder that is the name of your city.
Make sure that each city has it's own folder.
PHASE 2:
PROCESS YOUR IMAGE IN QGIS
Let's investigate that image and make it look amazing. In this phase, we open the image in QGIS and run calculations, adjust the colors, and potentially trim the image.
Step 2.1 : Bring your image into QGIS
If you haven't already, download the software for free at QGIS.org.
You should have several geotiff files from your image request from AppEEARS. Make sure you have a copy on your local machine and also a copy saved into the Urban Canopy Google Drive.
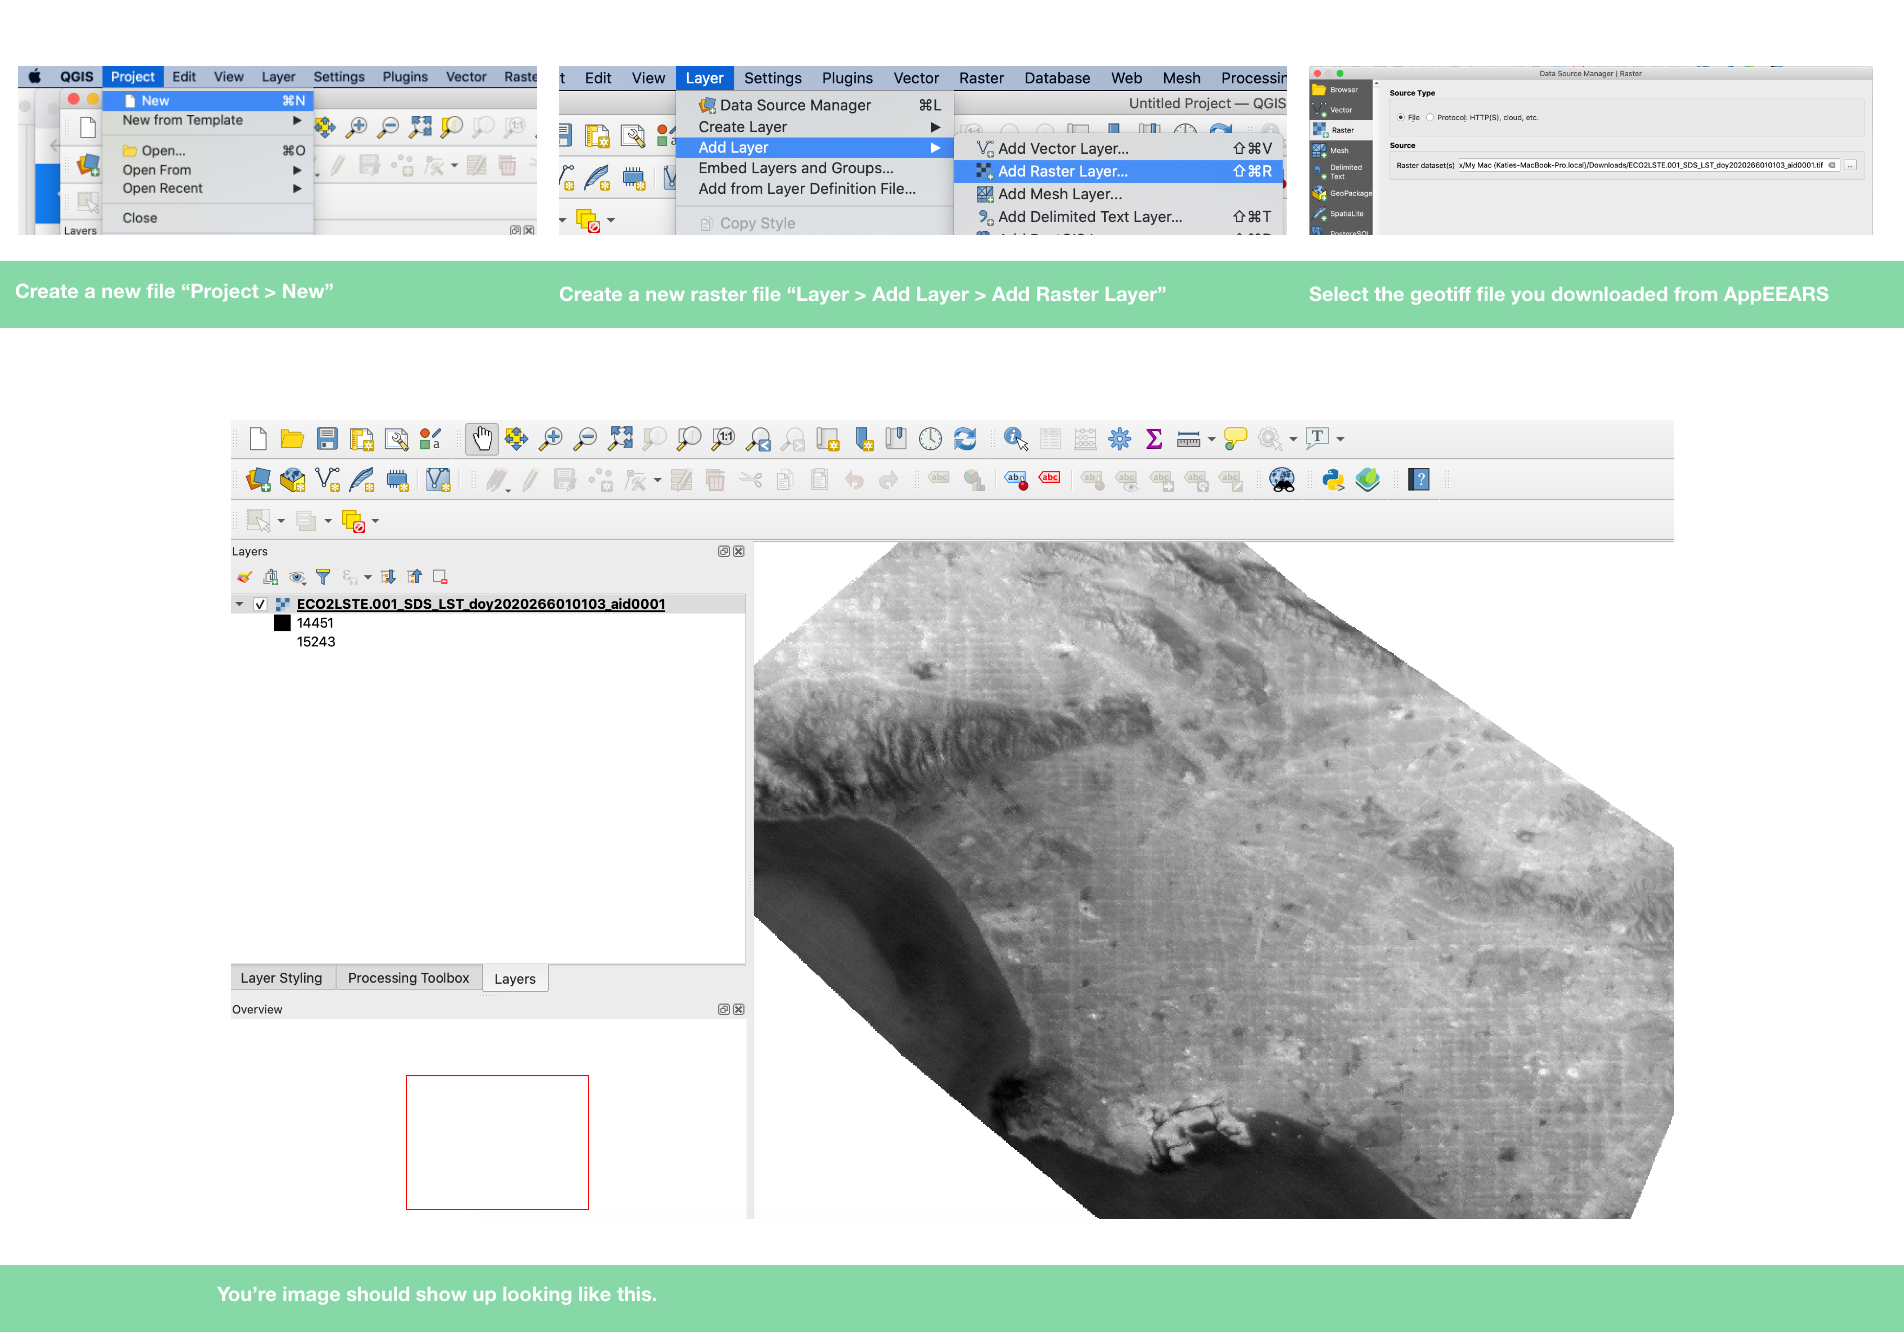
Open QGIS and click "Project > new" from the top navigation bar to start a new file.
Create a new raster layer "Layer > Add Layer > Add Raster Layer.
Select the geotiff you downloaded from AppEEARS.
Click "Add" then close.
You should see your heat island image show in QGIS in grey scale. You should be able to see features of your urban heat island such as roads being visible in a lighter color.
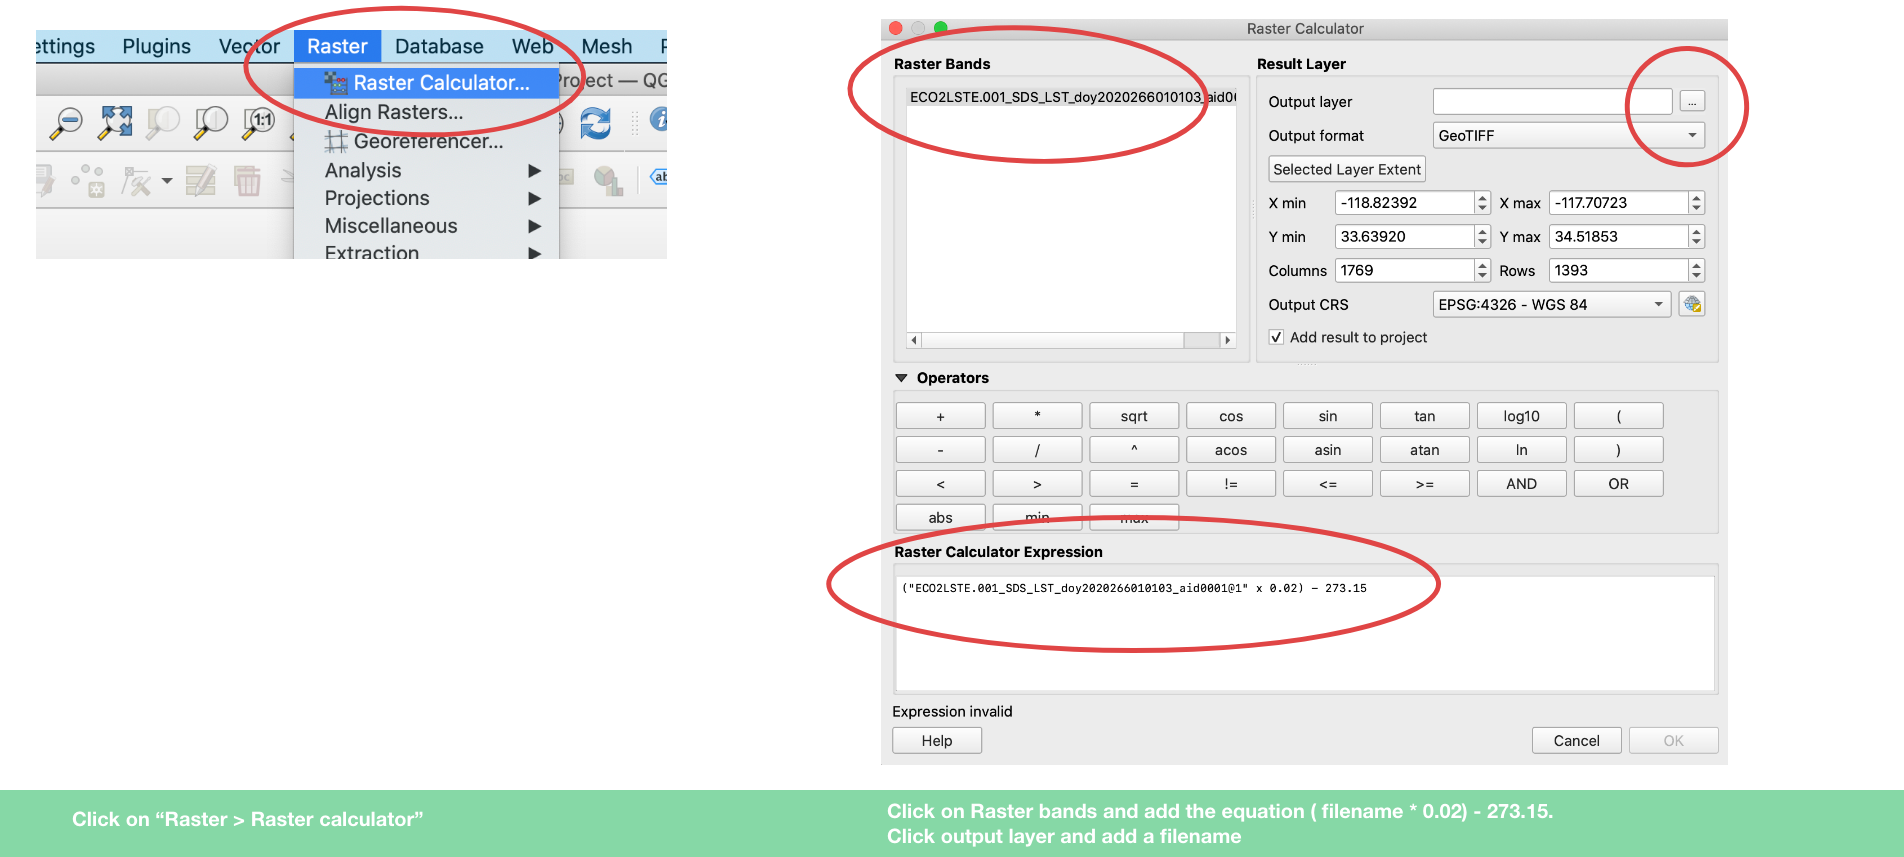
We need to turn the raw data to temperature values in celsius.
Click on "Raster > Raster Calculator"
A box will open. Double click on the raster band name. It should populate in the calculator field beneath. You'll need to multiple it by 0.02 (which will turn it to Kelvin) and subtract 273.15 to turn the data into Celsius.
Your equation should look like this:
("ECO2LSTE.001_SDS_LST_doy2020266010103_aid0001@1" * 0.02) - 273.15
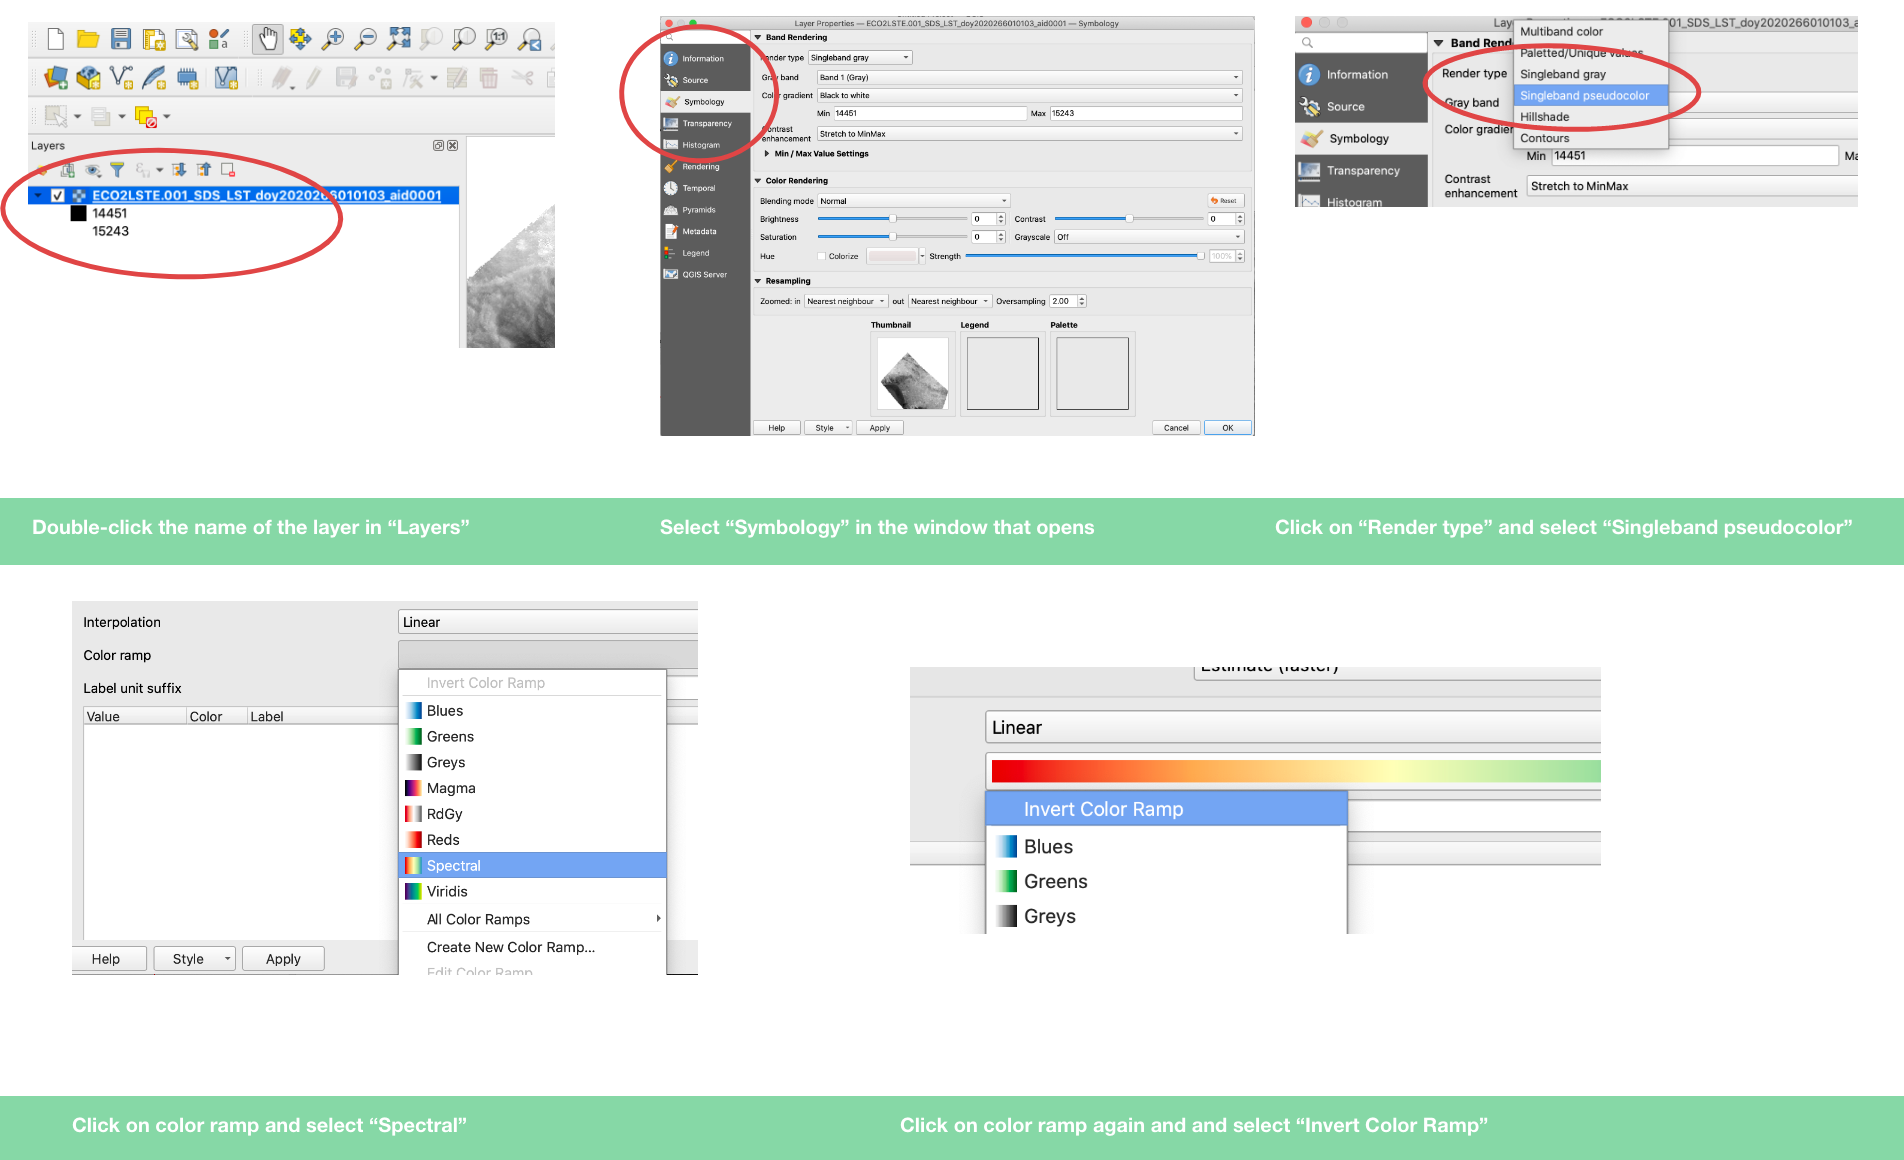
Step 2.2: Add color
Double click on new layer name in QGIS.
A window will open. Select "Symbology."
Click on "Rendertype > Singleband pseudocolor."
Go to the color ramp and click on the small dropdown menu on the right of the color bar and select "Spectral."
Click on the same dropdown again and select "Invert color ramp"
And bingo your greyscale image should now be rainbow!
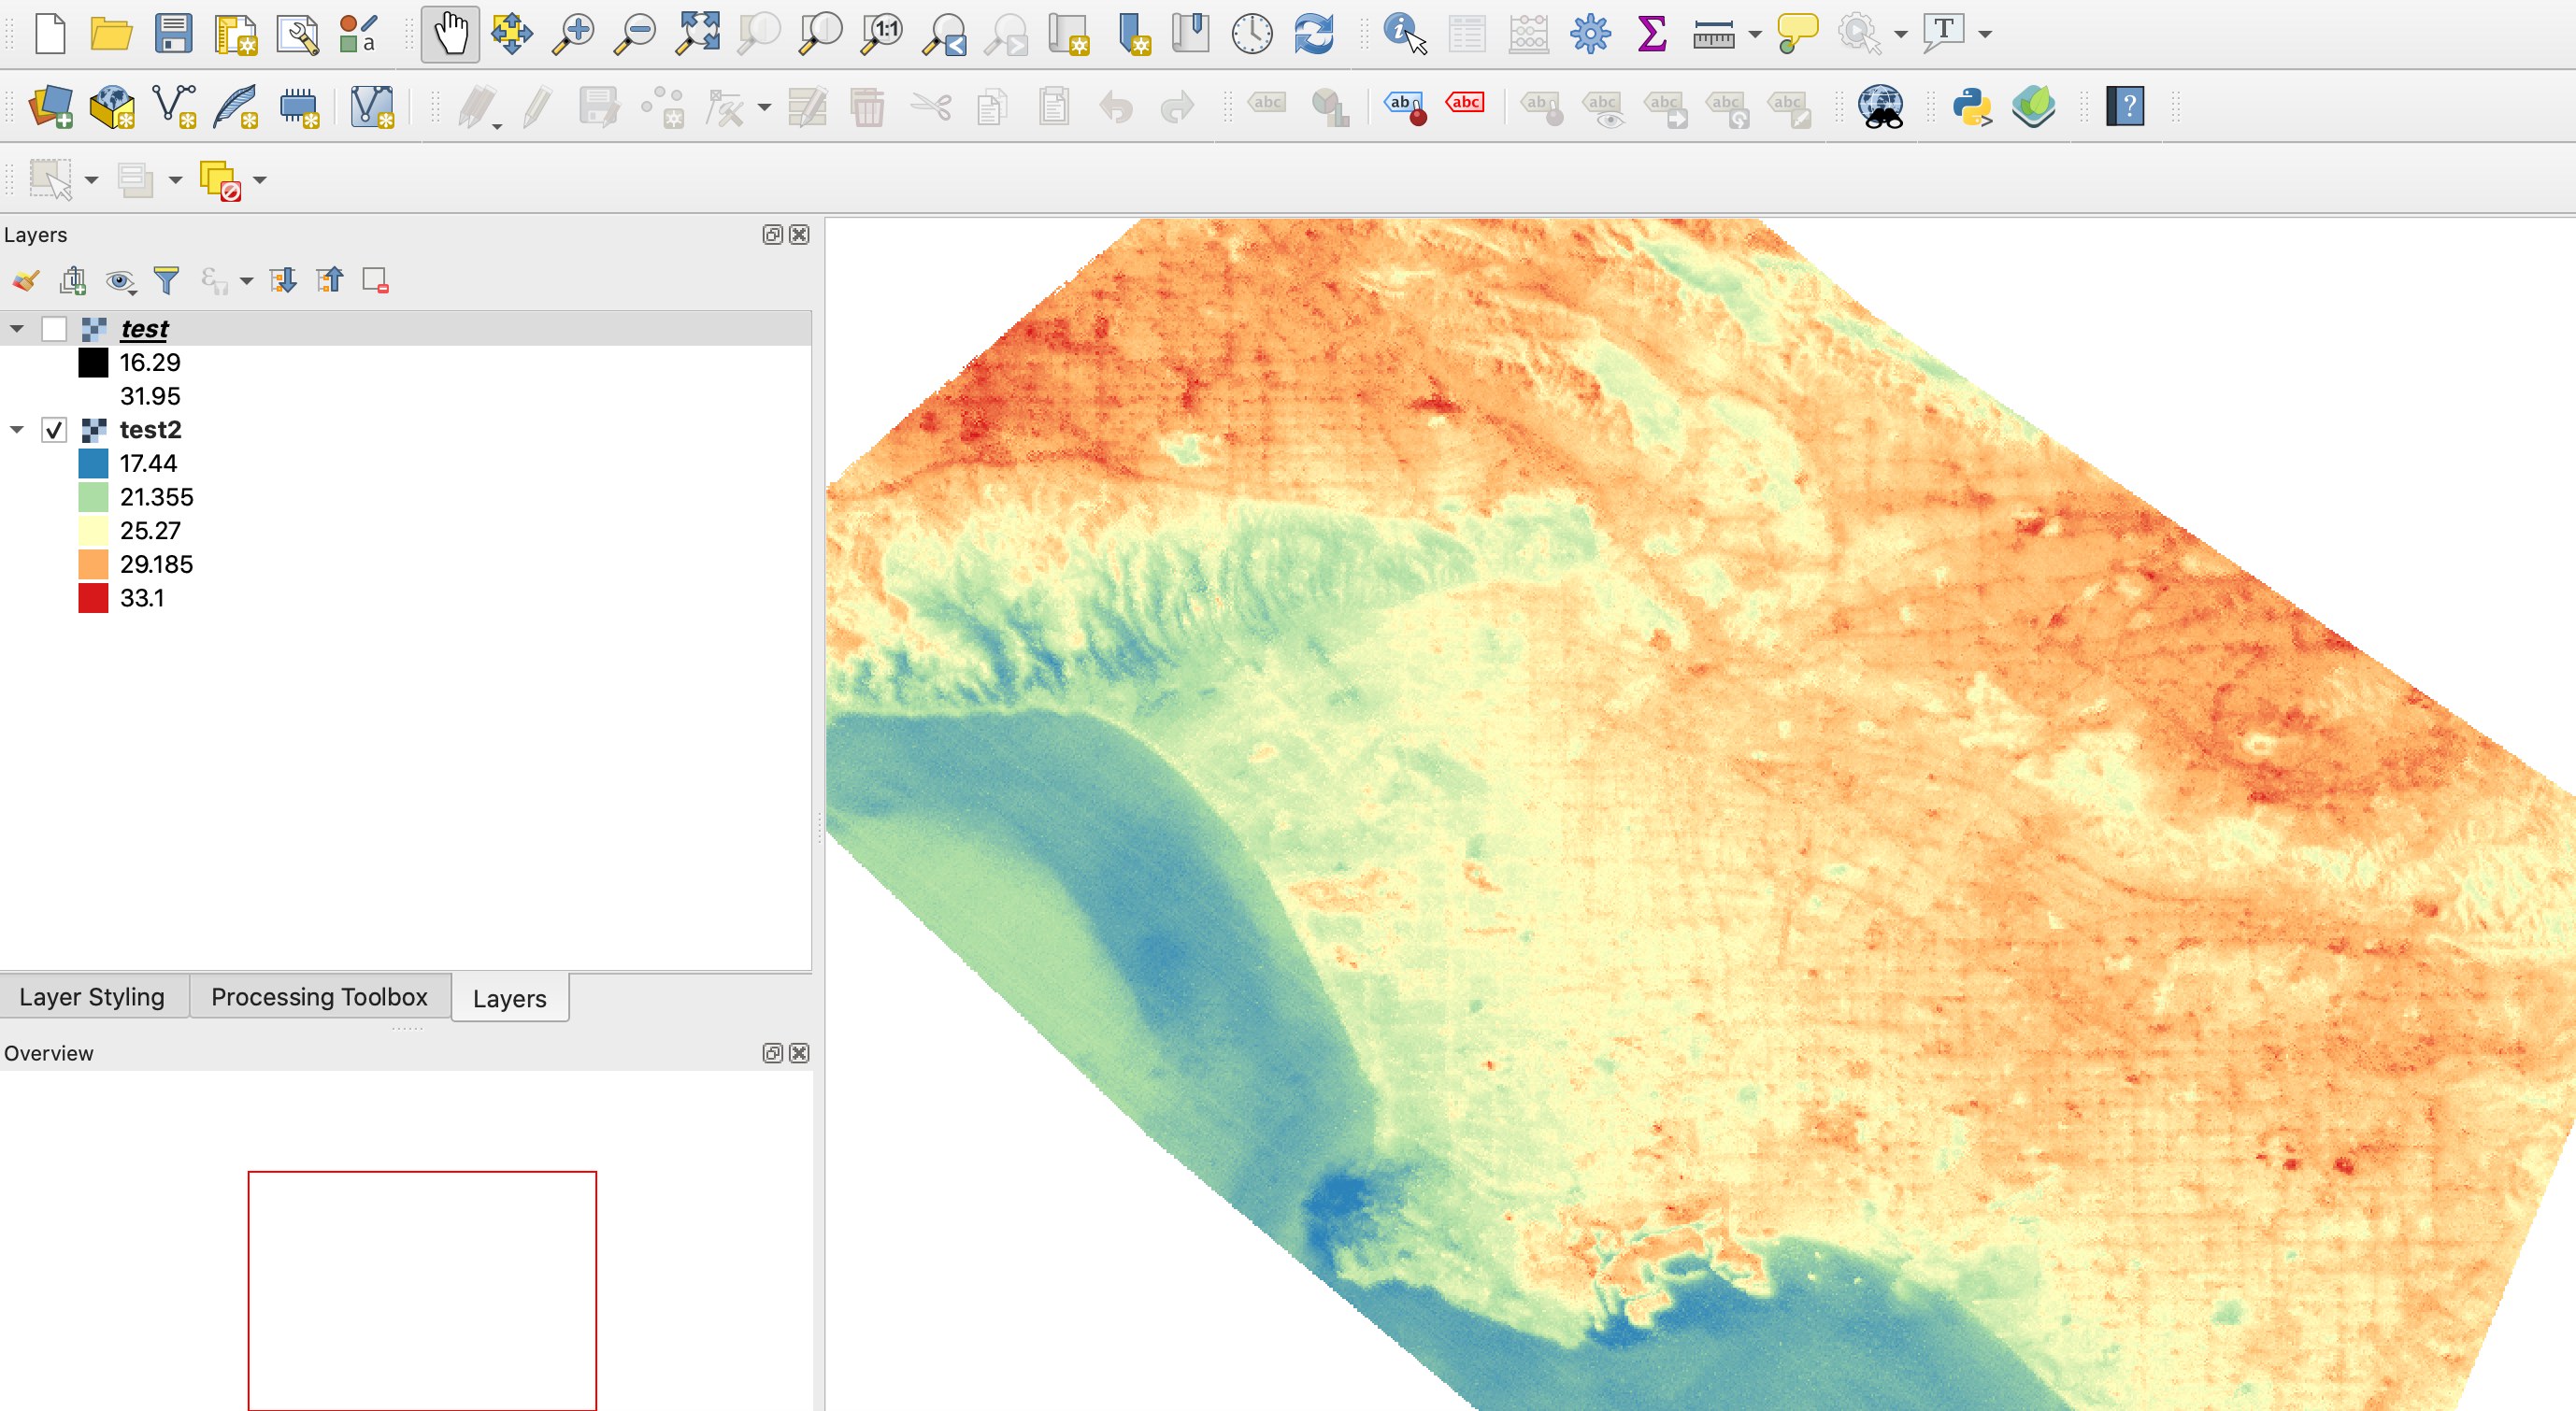
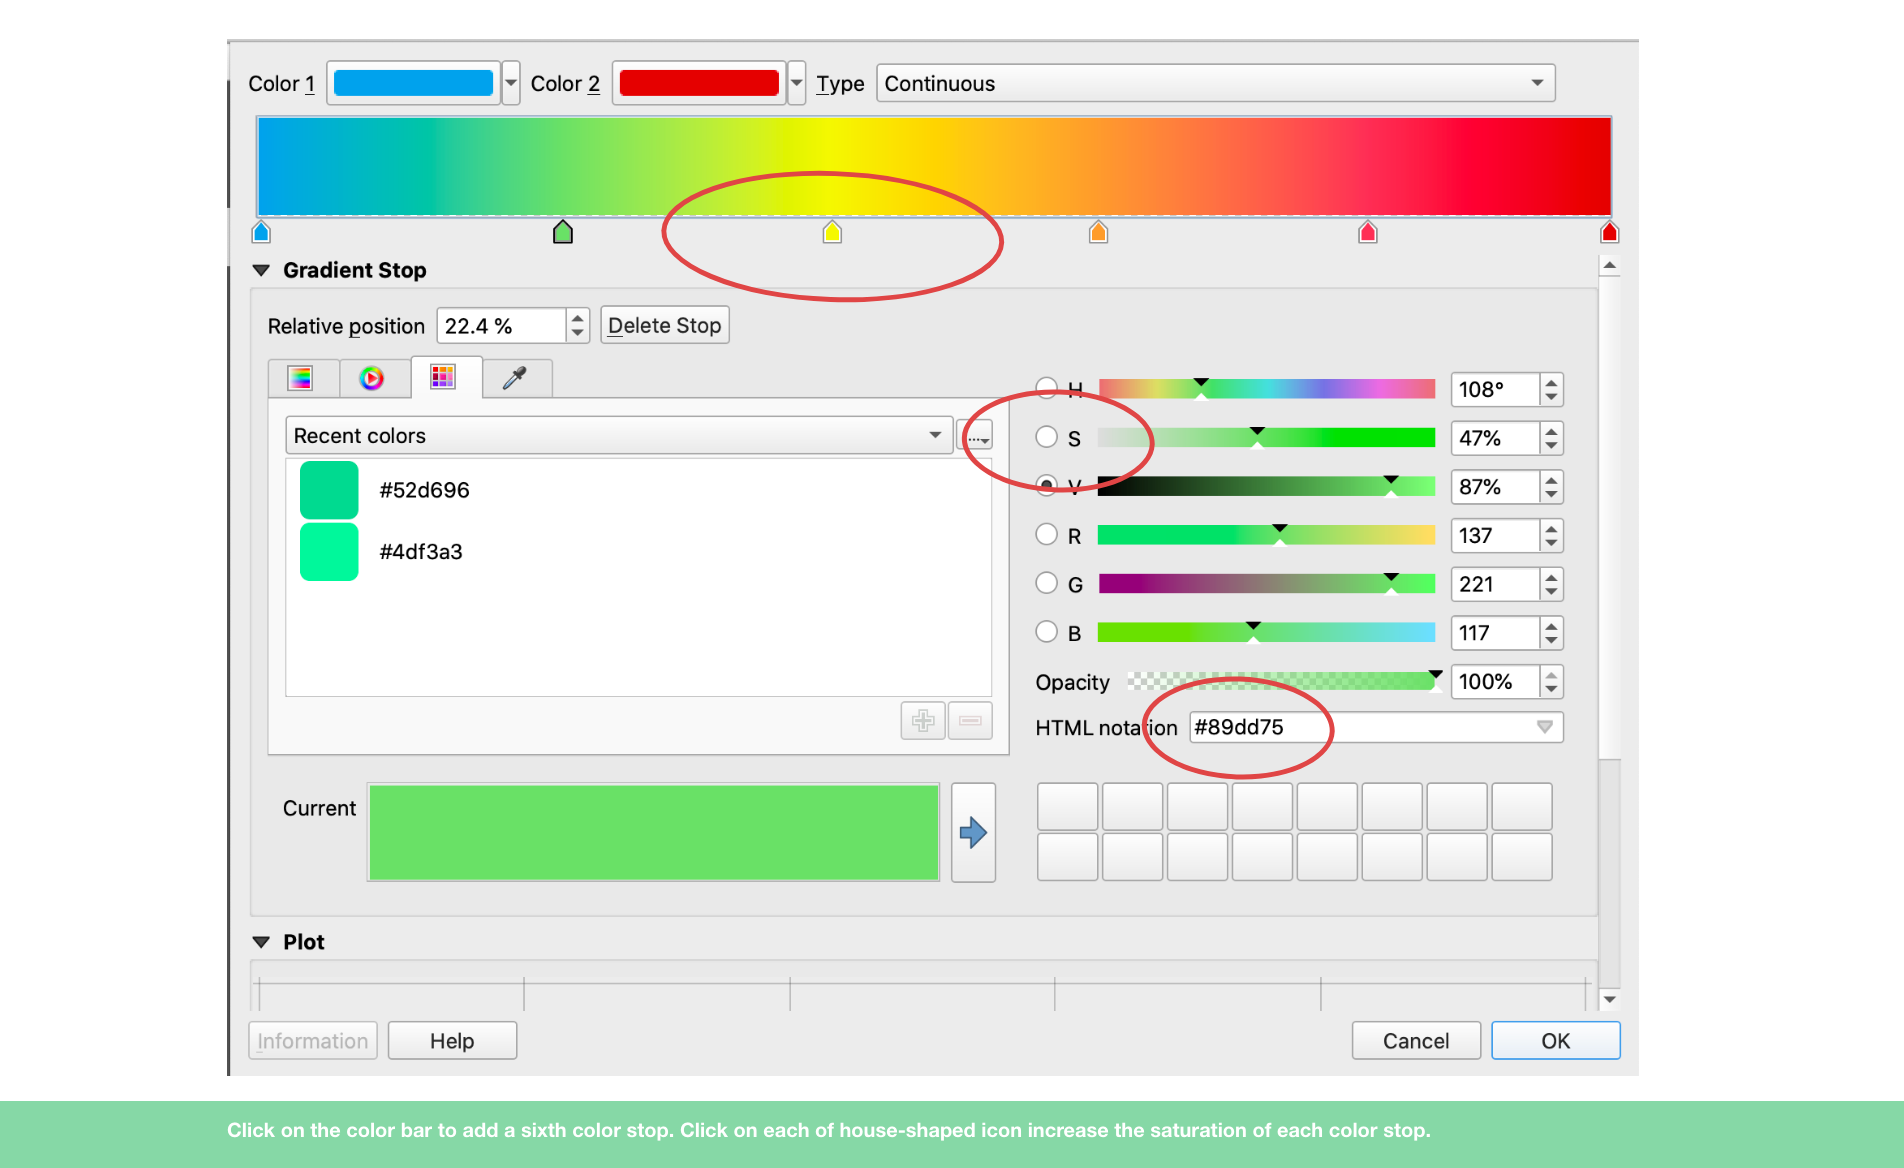
The default colors are a bit insipid, so let's enhance the color spectrum and saturation.
Click on the color band to add a sixth color interval. Then space each of the markers out evenly.
Click on the small color marker under the band (it's the shape of a tiny house) and increase the saturation of each color band.
Keep the colors spaced at equal intervals.
Adjust colors until you get a nice look. It can take some trial and error to get it looking good. The look will depend on the distribution of temperature data in your image. You may want to remove outliers and oceans to get a smoother distribution of data, which will give your image more contrast between colors.
Here are some example HEX color codes you can experiment with.
Map | Color Scheme | Color | Blue | Blue, light | Green | Yellow | Orange | Red |
Hex | #000092 | #005dfd | #05fdfc | #b0ff4e | #ffa001 | #f50100 | ||
RGB | 0,0,146 | 0, 93, 253 | 5,253,252 | 176,255,78 | 255, 160, 1 | 245, 1, 0 | ||
Hex | #000092 | #005dfd | #05fdfc | #fdff04 | #ffa001 | #f50100 | ||
CS4 | Hex | #000092 | #005dfd | #05fdfc | #f9f91a | #ffa001 | #f50100 | |
Here's a great example of color grading an ECOSTRESS image by John Noble. Try to get your image to look like this, showing somewhat equal amounts of all the colors (not all red or yellow for example). John is available for help on the Heat Island Hack Slack channel to guide you with the nuances of getting the color right.
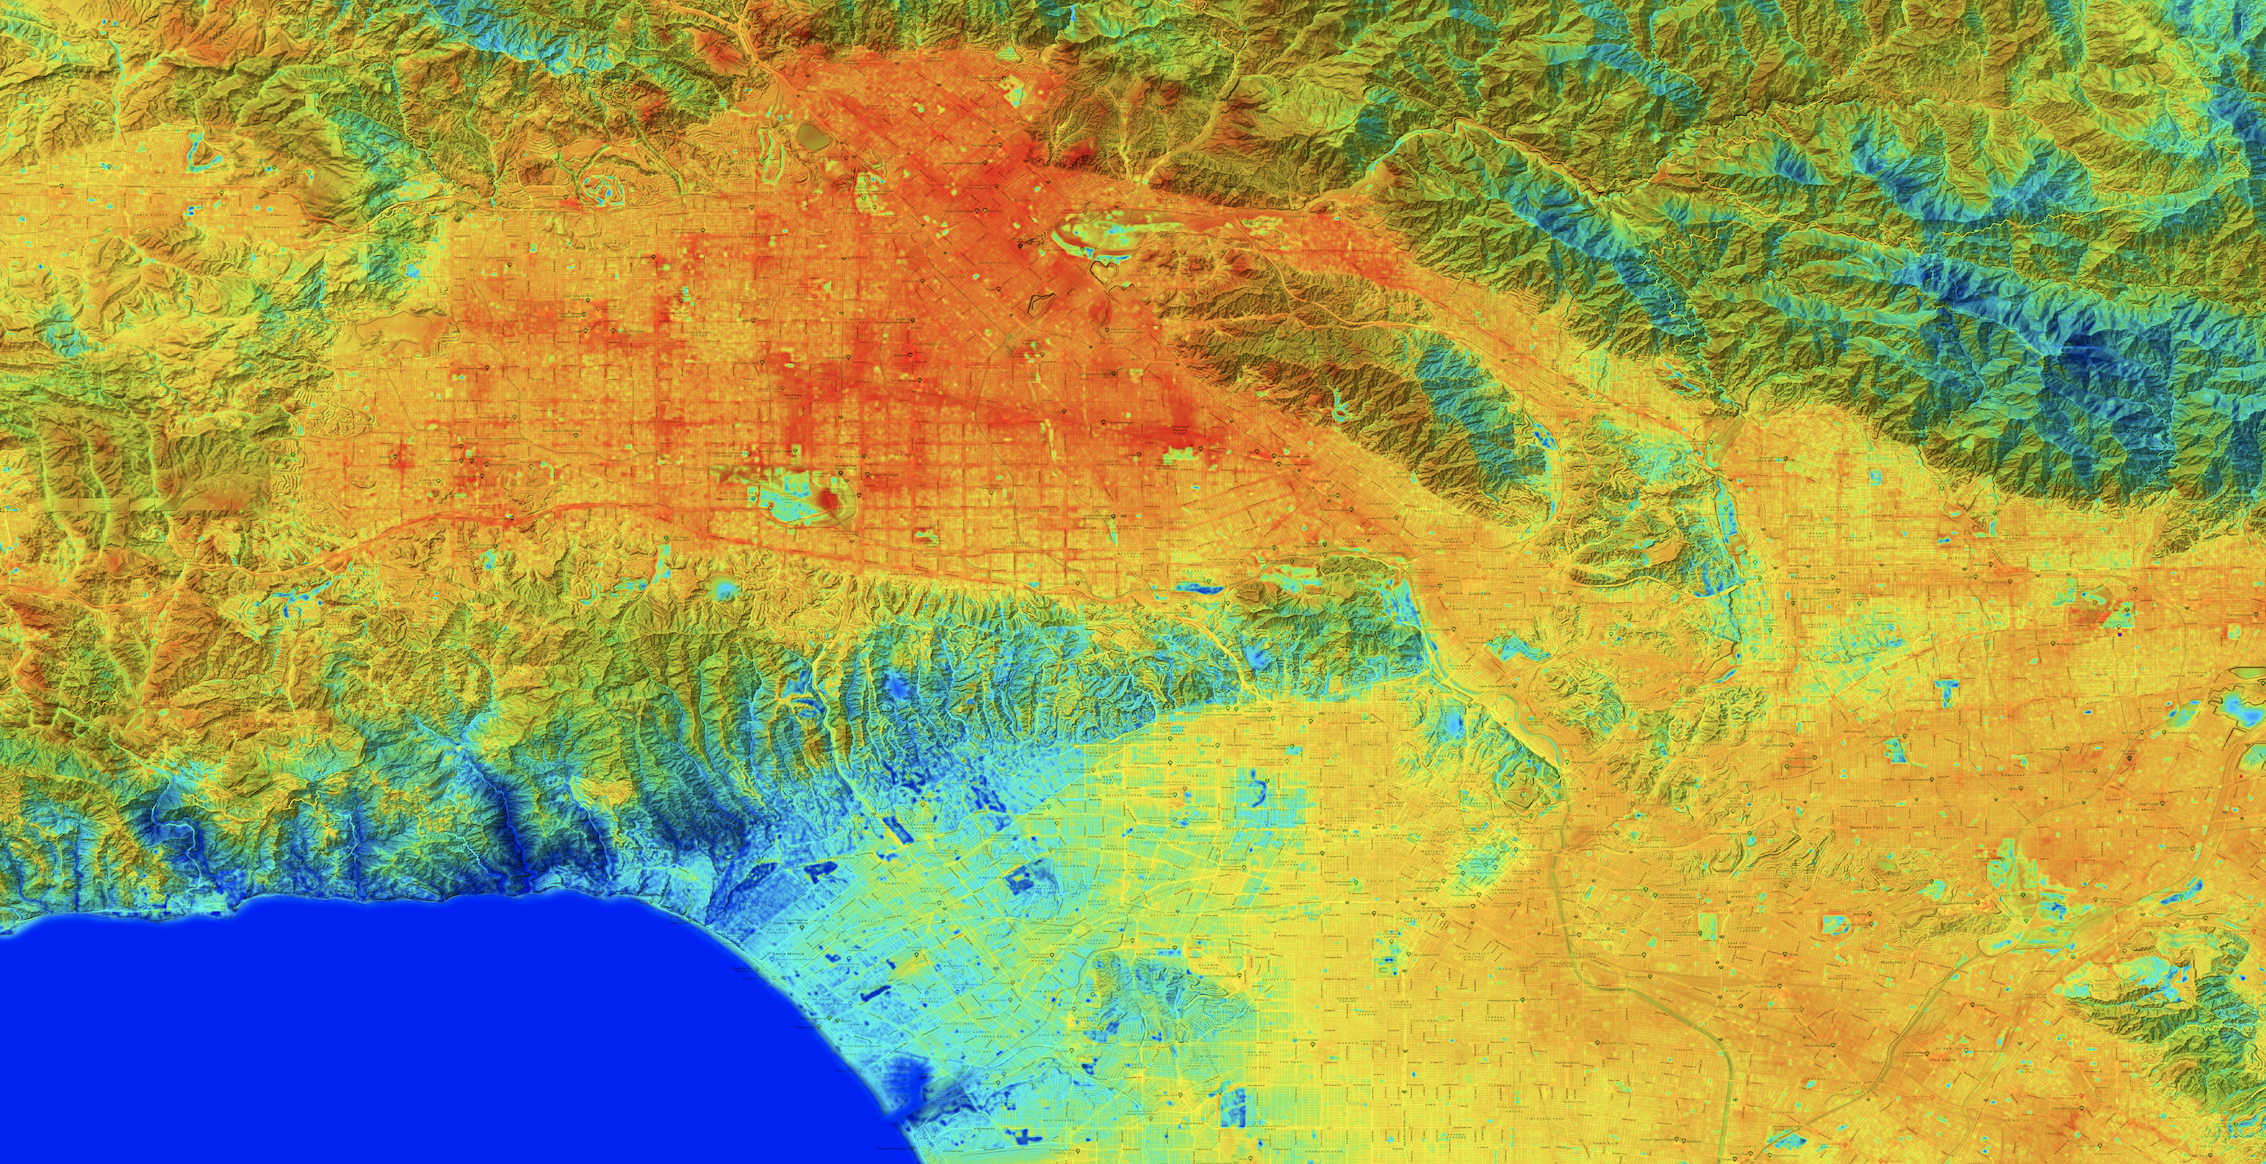
Your image probably won't look quite as smooth as the one above (it had some additional work done to it.) But you can add some additional smoothing. There's a later challenge to do image sharpening using machine learning tools in the advanced challenges.
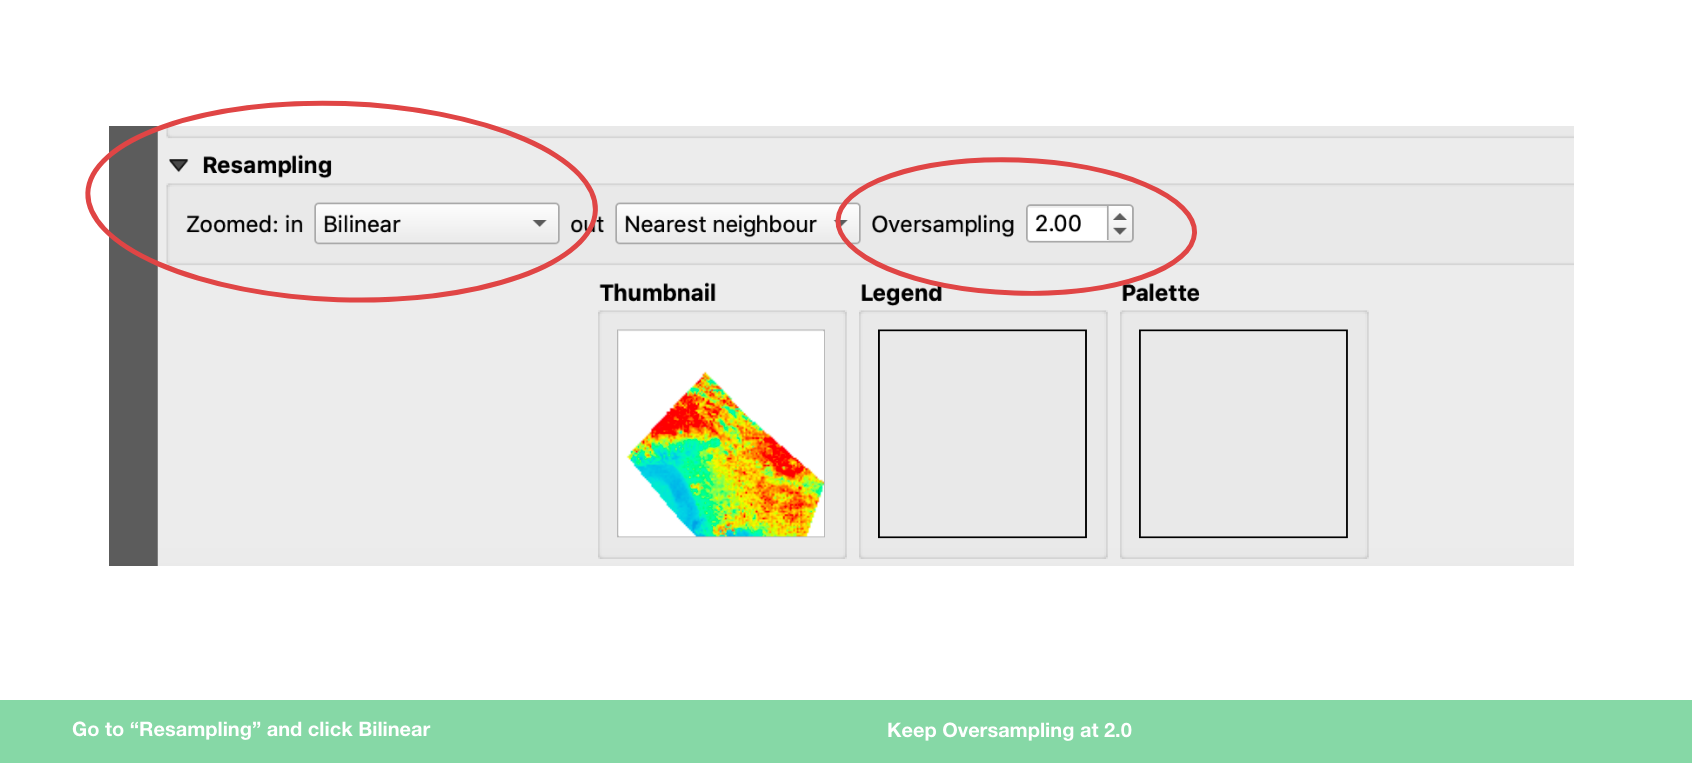
Double-clicking on the layer name in the layers window.
Click on "Symbology" and scroll to the bottom of the window where you'll see a section called "Resampling."
Click on the first dropdown called "Zoomed in" and select "Nearest neighbor."
Leave the oversampling at 2.0 and click OK.
Add your image as a PNG and PDF to the Urban Canopy Google Drive. Add a folder in the drive for your group. Make sure you name your file with the group name and the city name. Use this naming convention: GroupName_CityName.png
Step 2.3 Create a Mapbox tileset
In this step you will export your image in a format called a "Mapbox raster tileset." This means that your image will be sliced into thousands of squares into a format that Mapbox can load quickly for fast and easy zooming on the web or a phone.
In QGIS, add the plugin QMetaTiles. It will create your tiles.
Go to Plugins > Manage and Install Plugins.
Search for "QMetaTiles" in the popup window and select it and click "Install."
Make sure your layer is selected. Click on Plugins > QMetaTiles > QMetaTiles. A window will open.
Click on the "Browse" button and write the filename you'll use. Name your file "cityname_teamname_dateimagewastaken" and make sure you save your file to the Urban Canopy Google Drive in your team's folder.
Make sure you select the filetype MBTiles. Don't leave it as a zip file. It won't work to upload to Mapbox.
*These MBTiles files can easily be HUGE! They can take hours to process in QGIS and be up to 2GB. Do a test first with low resolution settings to make sure it's working.
Mapbox limits uploads through the studio interface to 300MB. Your tiles my easily be larger than that, meaning you'll have to use the Mapbox API.
Low resolution settings for QMetaTiles
Maximum zoom: 8
Tilewidth: 1024 (this needs to be a multiple of 256
Quality 50%
These settings should process your image quickly so you can test it in Mapbox Studio.
Final resolution settings for QMetaTiles
Maximum zoom: 15
Tilewidth: 512 (this needs to be a multiple of 256
Quality 70%
These higher resolution settings could take 1 - 3 hours for your computer to process.
Before you set your computer to do this, hop along to do the next tasks in step 2 and come back and let QGIS export for a while.
Step 2.4 : Import city boundary and calculate temperature distribution
* You can skip this step and go straight to 2.5 and come back to this step later if you run into bugs or running tight on time.
In this step you'll cut out your image using the city boundary and calculate the temperature distribution and the median temperature of the city. We want to work out the median temperature score so that we can compare each individual land score to the average, and target properties that have hotter than average scores.
Look at this instruction document for Goal 1 for more detail on this section.
We need to run calculations for land within city boundaries, because that's how cities manage their environmental programs and data.
(Your Mapbox tile export doesn't need to be in the shape legal city boundary. It's good to keep it wider because cities can be unusual shapes and it helps to see the surrounding land. But to calculate city and land scores, we do need to run these calculations from within the boundary.)
Step 2.5: Calculate temperature for each individual land parcel
Work out how to calculate the heat score percentile for each land parcel within a given city boundary using QGIS.
Look at this instruction document in Goal 2 for more detail on this section. -
At the end of this step, make sure you have an exported list of each land parcel ID (hopefully address, too, if you can get it) and the temperature of each land parcel.
Step 2.7: Find your city's top 10 hottest and coolest properties
Now that you have the temperature of each land parcel in your city, export a CSV file of all the addresses within the city with their temperature values. You may want to choose just a neighborhood or part of the city to do this, especially if your city is very large like NYC or LA.
Depending on the city you are working on, you may or may not be able to easily get information on land parcel IDs and addresses. This can take some tinkering with your city's GIS website. Cities usually have a website where you can look up a parcel ID and find out the street address.
Save your export of addresses, parcel IDs, and temperature values.
Make a list of the top 10 hottest properties.
Look each of these properties up on Google Maps Satellite view and see what kind of property it is. Is it a parking lot? A campus? Are they commercial businesses or homes?
Take screen grabs of the thermal view and the Google Satellite view of each of your top 10 hot spots and add them to your group folder. You can turn these into social media posts, blogs, or stories later.
What phenomena or trend did you discover from looking into the top 10 hottest properties?
Now make a list of the top 10 coolest properties and do the same thing.
Look each of these properties up on Google Maps Satellite view and see what kind of property it is. Is it a park? A golf course? A school?
Look out for land formations, businesses, and infrastructure that is causing the upper temperature percentiles.
Which major corporations have the highest and lowest temperature scores in a city?
Which schools have the highest and lowest temperature scores in a city?
What are the top 5 hottest carparks?
Take screen grabs of the thermal view and the Google Satellite view of each of your top 10 coolest spots and add them to your group folder. You can turn these into social media posts, blogs, or stories later to show the comparison of what types of properties are hot and what is cool.
Save your list of top 10 hottest and top 10 coolest properties into a text or csv file and save it into your group folder.
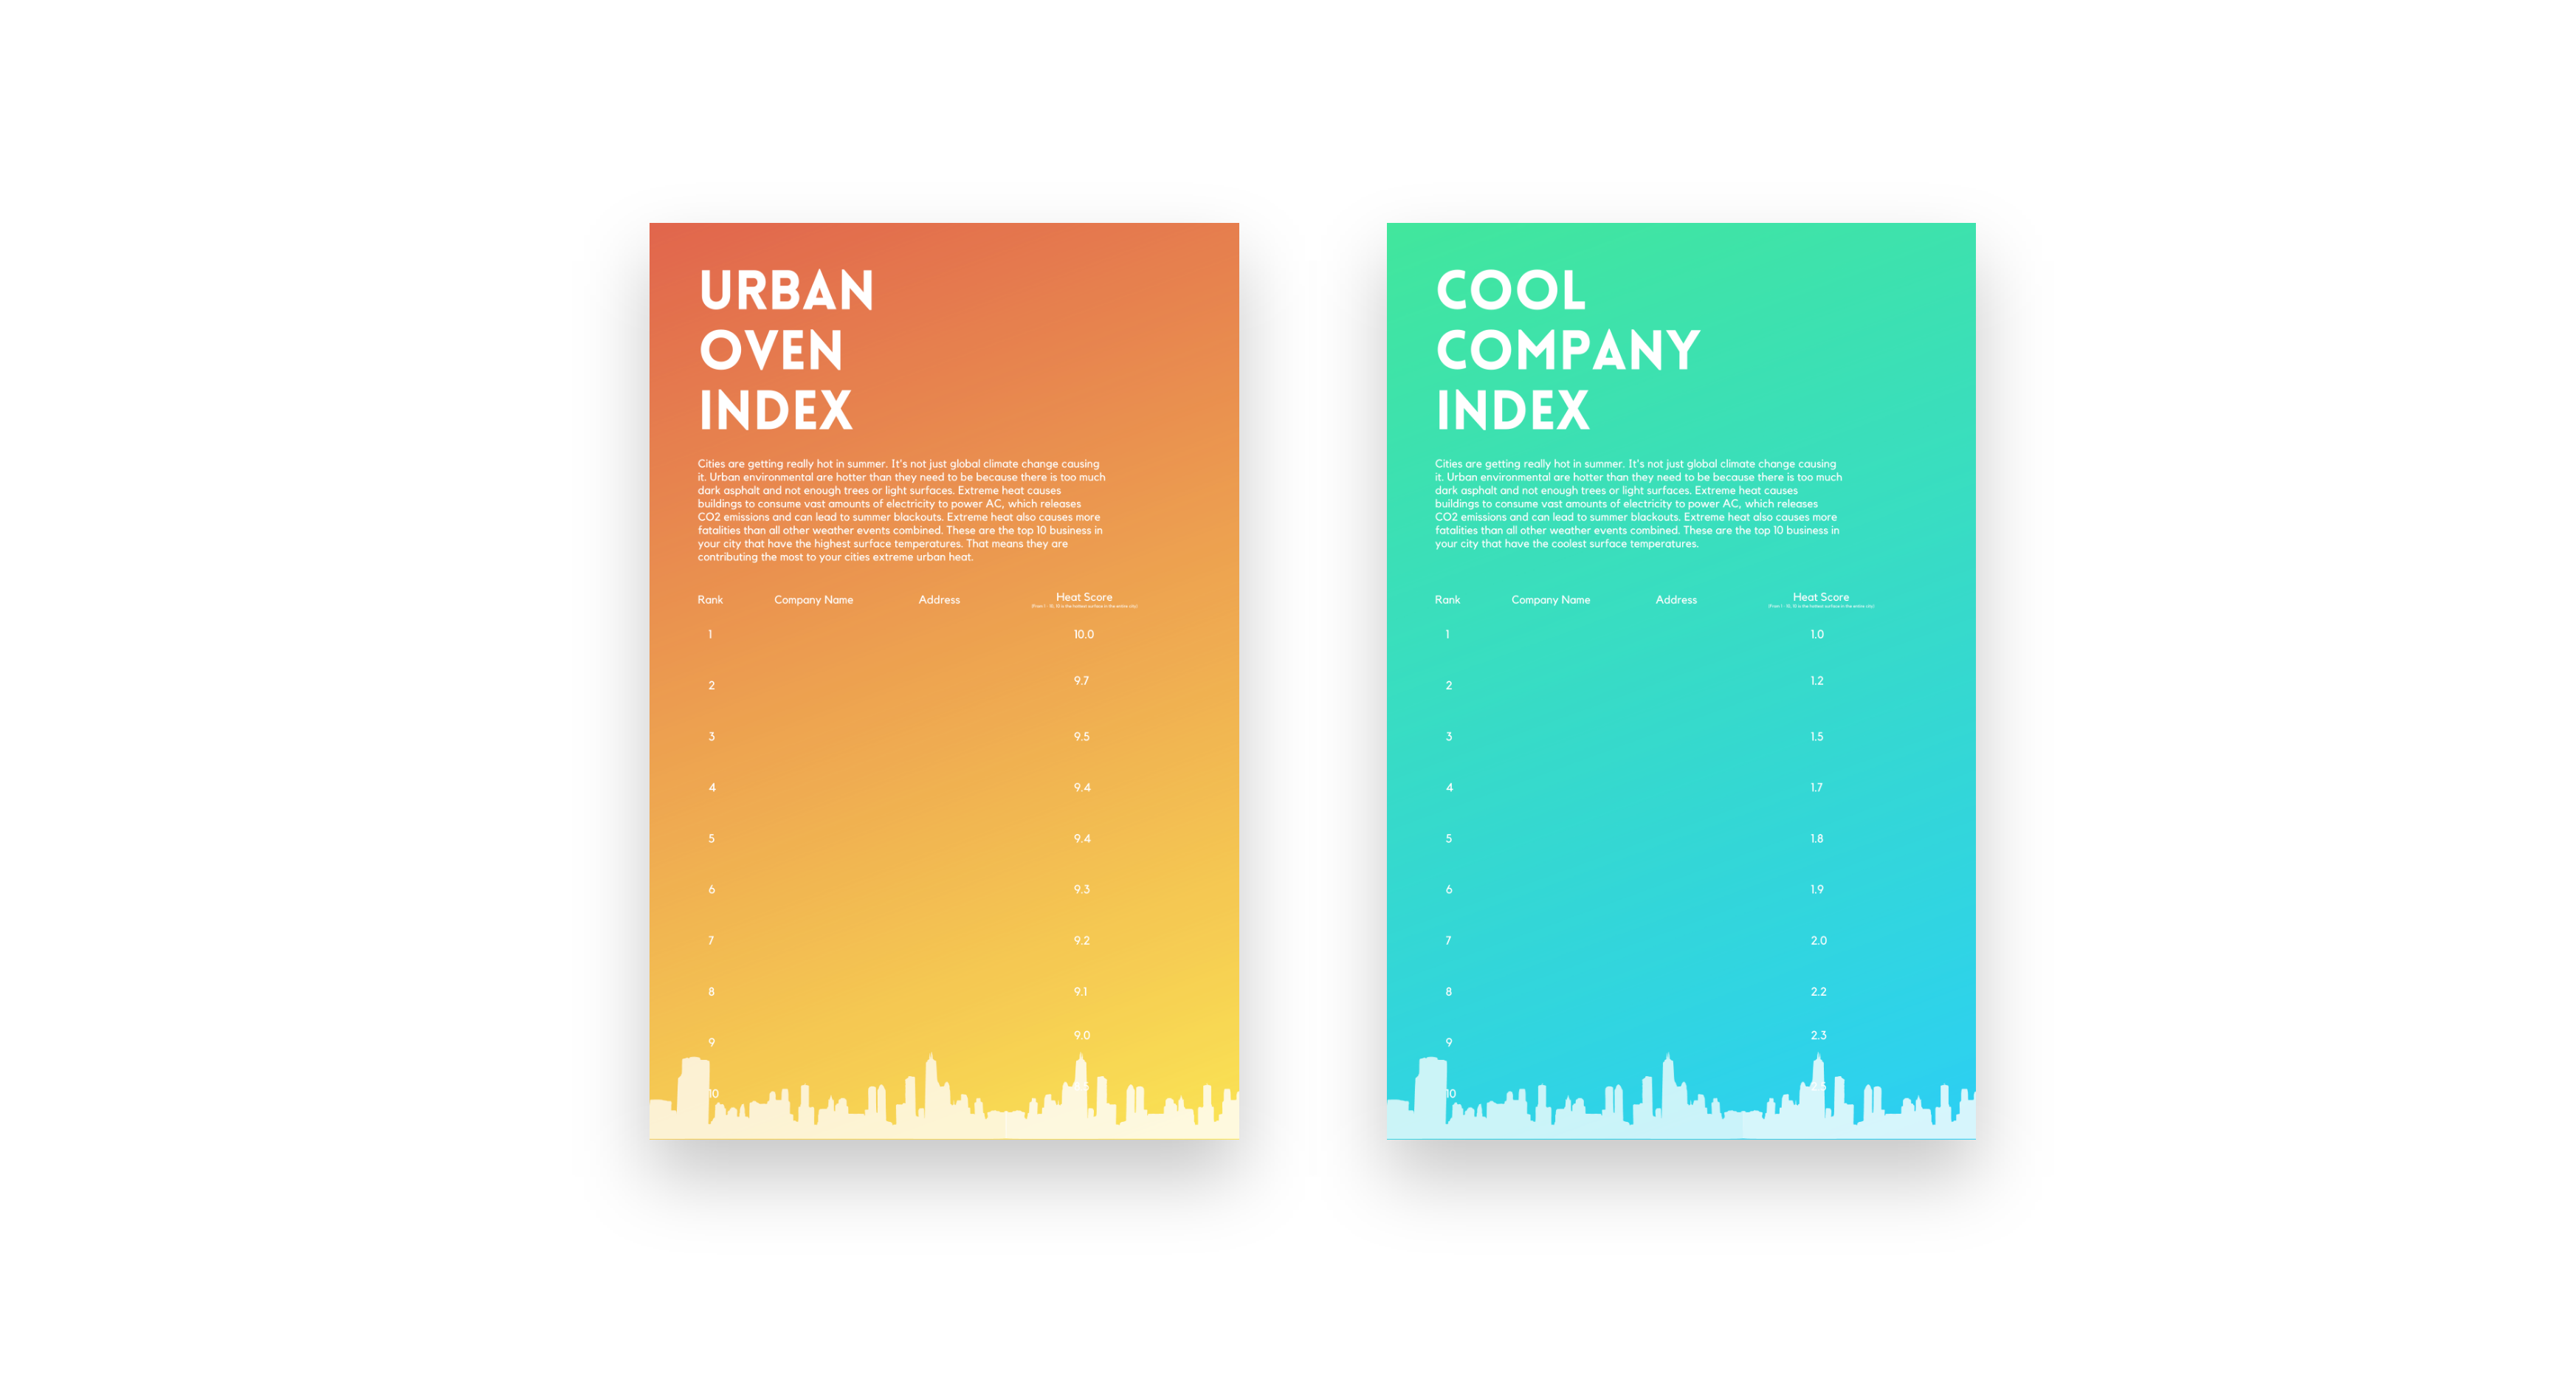
If you're interested, take on an extended challenge and jump onto canva.com and create an "Urban Oven" poster listing the top 10 hottest properties or businesses, as well as one for the 'Cool Cities" properties. Below is an example of one we've already done.
PHASE 3:
IMPORT YOUR MAP INTO MAPBOX
Let's get your city into a format that lots of people can search for, and view, in a web browser. In this phase, we'll bring your city into map application software, Mapbox.
Step 3.1: Import MBTiles to Mapbox
There are a few different methods of importing data into Mapbox
We're going to pull everyone's raster MBTiles into the one master Urban Canopy Mapbox account that will be publicly available at urbancanopy.io. Make sure your MBTiles file is saved to the Google Drive so we can upload it to the master account.
But you also want to set up your own Mapbox account to test out your mbtiles, to learn Mapbox, and make your own unique design adjustments to the map.
Set up an account on Mapbox.com
Navigate to Mapbox Studio (this is where ) https://studio.mapbox.com/
Click on "Tilesets" and then "New tileset" and upload your mbtiles file.
If your file is over 300MB, you'll need to use the API. (Remember, try the small file size version first to test it out.).
Now your tiles are uploaded, go back to Mapbox Studio.
Click on "New Style" and choose a template look that you like and click on "Customize (template name)."
Click on "Layers" on the top left and click the "+" to create a new layer.
Click on "Source" and your tilesets should appear.
Click on your tileset you just uploaded, and open it and double-click on the file inside. It should now appear on your map.
Go to the search bar in the top right hand corner and search for city.
Bingo! Your heat island map should appear.
You can play around with Mapbox settings for what land features show and what colors to use.
Click on "Publish" then click on "Share." You'll get a link you can copy and paste into a browser and share you map with anyone.
Take a screen grab of your map and post it in the hackathon Slack channel! Add your mapbox public url, too. We can't wait to see what you've created!
If you are doing a test run with a small mbtiles test file, go through the process again with the final settings for the larger file size.
After we've got all the heat island files in, we'll begin uploading them to the master Urban Canopy map and all the heat island images for different cities around the world will be together.
Congratulations! You made an urban heat island map
Image sharpening tutorial
We can increase the resolution of the thermal image by putting two images together and running a machine learning script that predicts the temperature at greater resolution.
This is a tutorial that uses something called "random forest" to increase the resolution of your images from 70 meters per pixel to 30 meters per pixel. It works by slicing the pixels up to make more pixels, then using the Landsat 8 data for albedo (how dark or light something is) and for vegetation density (from the near-infrared spectrum) and it predicts the surface temperature in the smaller pixels. This process will make a smoother and nicer looking image with more detail where you'll be able to better identify specific hot objects. This paper helps explain the process.
1. Find your corresponding Landsat 8 image with no clouds
You'll need two images for this - ECOSTRESS and Landsat 8 for the same location for about the same time of year.
You'll need to find a Landsat 8 image of the same city you have the ECOSTRESS image for.
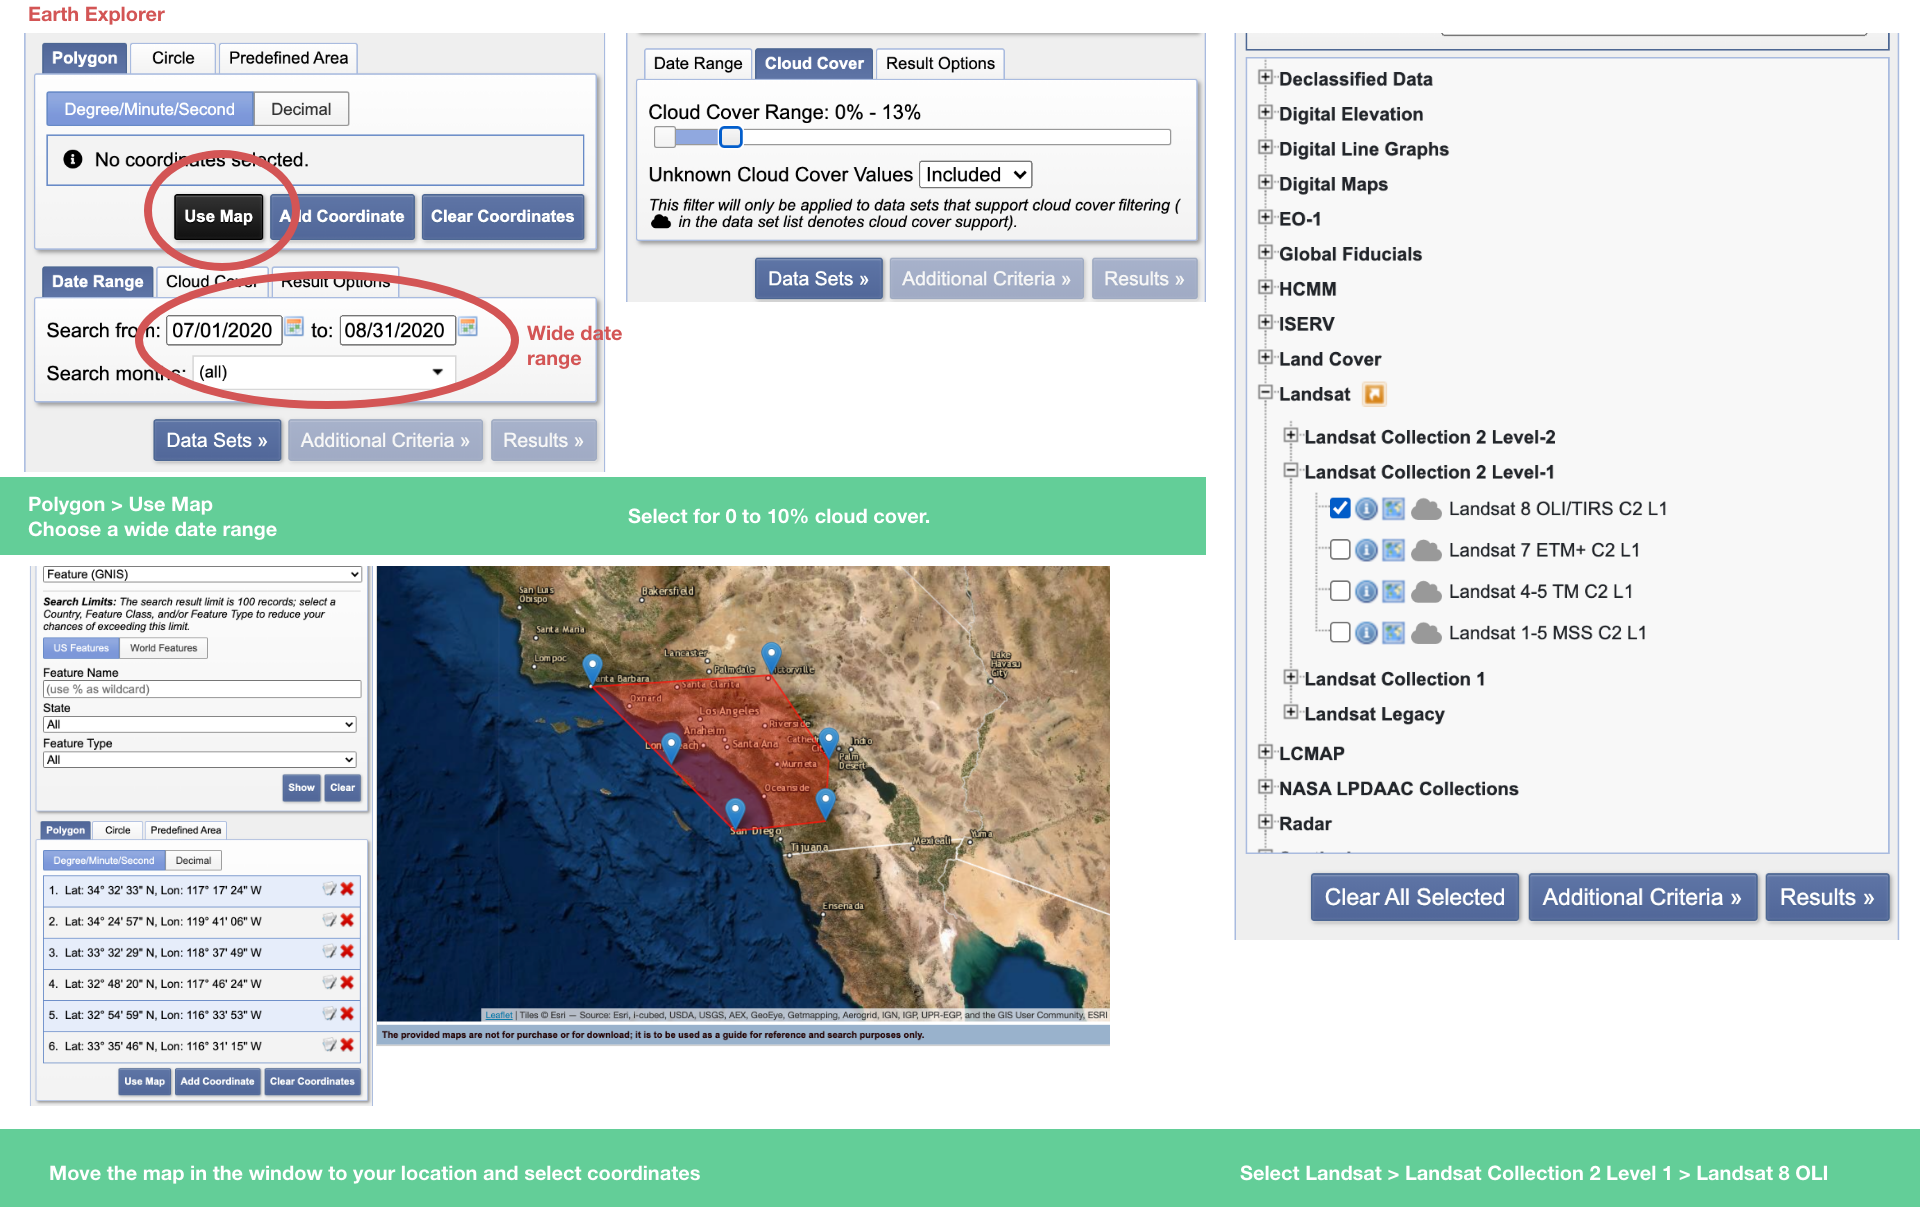
Step 1: Browse Landsat 8 images to find clear no-cloud days using Earth Explorer
First, you'll need to look through the available images on Earth Explorer. It's important to find images with no cloud cover. There is a slider in the search query that that allows you to select for a percentage of clouds. Keep it at 10%.
Add a wide date range of 3 months during summer month when you are using Earth Explorer. Landsat 8 only photographs each location about every 2 weeks, and some of these times may have cloud cover, so you'll need a wide time frame to find the best possible image. If you are searching in the USA, your search might cover July, August, and September.
The purpose of using Earth Explorer to first look at the images is to eliminate images with cloud cover - and also see if the images cover the entire city area.
Once you on Earth Explorer,
Polygon – Use Map
Select polygon and corner coordinates of area of interest (you can actually zoom in to the map and it will auto-select your coordinates.)
Datasets-> Landsat -> Landsat Collection 2 Level-1 -> Landsat 8 OLI/TIRS C2 L1
Choosing an image for the corresponding month is best. If there isn't a good quality image for that year, you can try a year before, such as 2019 or 2018 for the same month of. your ECOSTRESS image.
**If you just want to practice running the image sharpening script, you can download sample images here we prepared earlier.
2. Request to download your Landsat 8 image
Request Landsat images for those dates for download using AppEEARS
Once you've discovered high quality images, note the dates they occurred on, then apply to download the images through AppEEARS for the exact dates the images occurred.
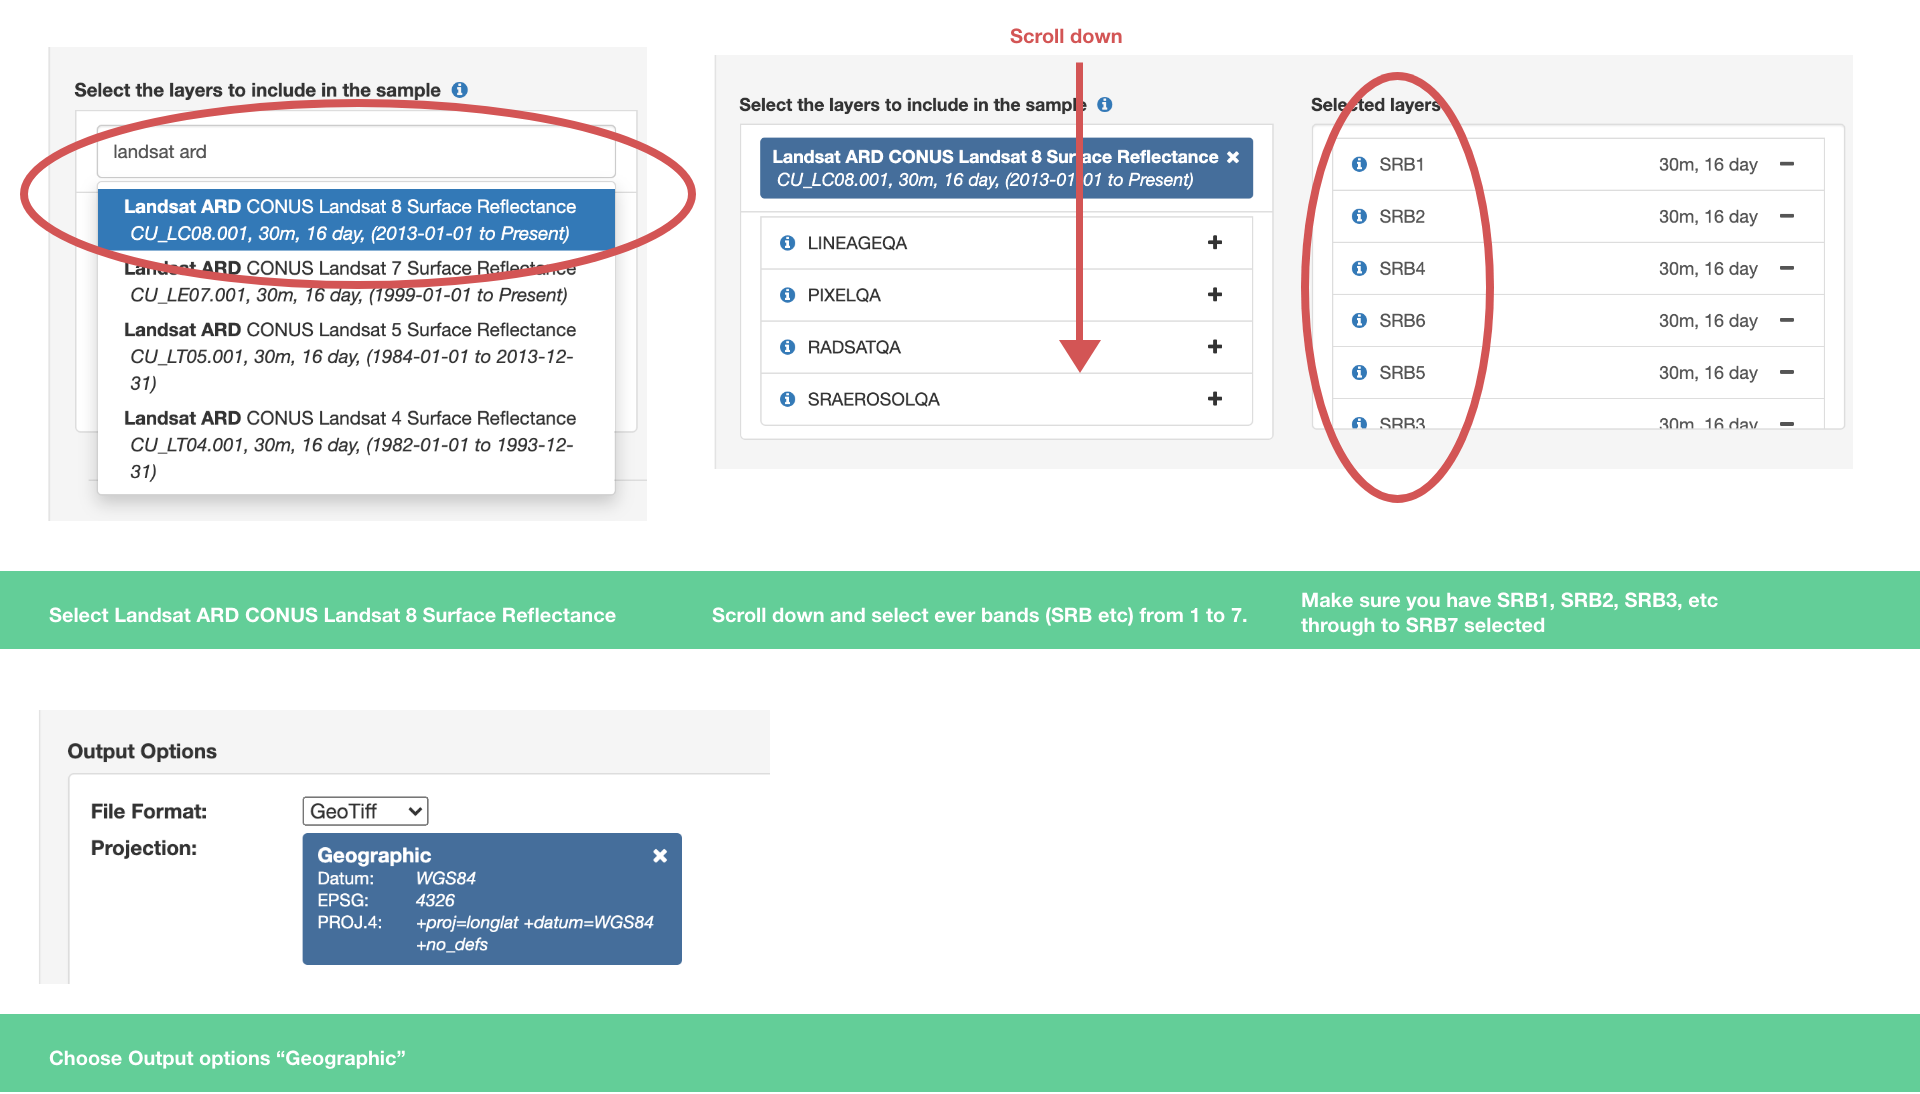
Here's how to search for your Landsat image in AppEEARS.
Go to AppEEARS and as you did in the earlier step.
Go to Extract (top nav) > Area Sample.
Choose Landsat ARD CONUS Landsat 8 Surface Reflectance
Select all the color bands SRB 1, SRB 2, SRB 3, SRB 4, SRB 5, SRB 6, and SRB 7
For output options, choose Geographic
Choosing an image for the corresponding month is best. If there isn't a good quality image for that year, you can try a year before, such as 2019 or 2018 for the same month of. your ECOSTRESS image.
Save your images in a folder. Note the directory path for the next step.
You'll see a different image available for each band. Download each of the seven SRB layers.
**If you just want to practice running the image sharpening script, you can download this zip file of sample images we prepared earlier.
3. Download and install R or Matlab
R is a free, open-source statistical analysis tool. Download it here and install.
You'll also need to install R's raster package https://r-forge.r-project.org/R/?group_id=294
Matlab is a paid program available here. You can sign up for a 30 day free trial for Matlab here, or purchase a student license for $99. If you are enrolled in a university, you can probably get a license through your school.
*FYI - It can take a a few hours to download and install these programs. Check that your computer has enough space for them!
You may also wish to convert the code to Python if that's your preferred program
4. Copy and paste your script into the console and run
Copy and paste your code into the window on the console on R or Matlab.
Download R image sharpening script here
Download Matlab image sharpening script here
Check your directory paths to make sure your code can access your images.
Once you've run the code, it should save a sharpened geo-tiff to your folder.
Your new image should look smooth! Congratulations!
You can now bring your new image into QGIS and go back to the earlier steps in the tutorial to colorize the image and prepare it into a Mapbox tiles file.
Place your sharpeneing image and Mapbox tiles file in the Urban Canopy Google Drive. We will upload it to the master global map!
Trouble shooting 1:
Adjusting inaccurate geo-coordinates for Ecostress
Check and adjusting geo-coordinates of your ECOSTRESS image
Because the ECOSTRESS data comes from the International Space Station which can bump around sometimes, you will need to check that the geo-coordinates of your EcoStress image are exactly matching what you'll see on Google Maps (or similar). Sometimes they are slightly inaccurate.
Bring your ECOSTRESS sample into QGIS and see if major features like coast lines or major roads lines up perfectly with a base map like Open Street Maps.
Adjust the geo coordinates to make sure the ECOSTRESS image is correct and matched to the Landsat 8 image.
Here are instructions and a script that can do it for you in Matlab.
(Note - this tutorial is for Earth data search in hdf5 format, and not AppEEARS area samples in geotiff. You'll need to modify to make it work on the geotiff data, but the methodology is the same.)
It just shifts the geo-values a degree or so.
Trouble shooting 2:
Stitching together 2 incomplete Landsat images
You may need to stitch together a few different Landsat 8 images
Landsat 8 captures a smaller area at one time, so when you inspect your results, it could have only half of the city shown. If that happens, you may need to stitch two or three image together so they cover your city. You can do this is QGIS, or Matlab, or look for various image stitching softwares online.
See more advanced challenges to add to your heat island map