
More activities to enhance your heat island map!
1. Compare thermal with tree cover with Google Earth Engine
There is a strong relationship between tree cover and urban heat. You can add an additional layer of data to you map of the vegetation cover. Google Earth Engine has a high resolution layer of aerial image imagery taken by USGS. There's a feature where you can select NDVI (vegetation index) using the NAIP data set. You may be able to calculate the relationship between trees and surface temperature, or visually show it on your Mapbox project.
2. Additional data correlations
Urban heat effects, and is effected by, many different types of data. You may want to investigate other data sets and how they correlate with urban heat.
Other kids of data might include air temperature, air pollution, CO2 emissions from electricity consumption, property values, income, education, race, and crime. There is often a strong relationship between disadvantaged communities living in areas that have less trees and experience more extreme heat.
3. Physical cooling products
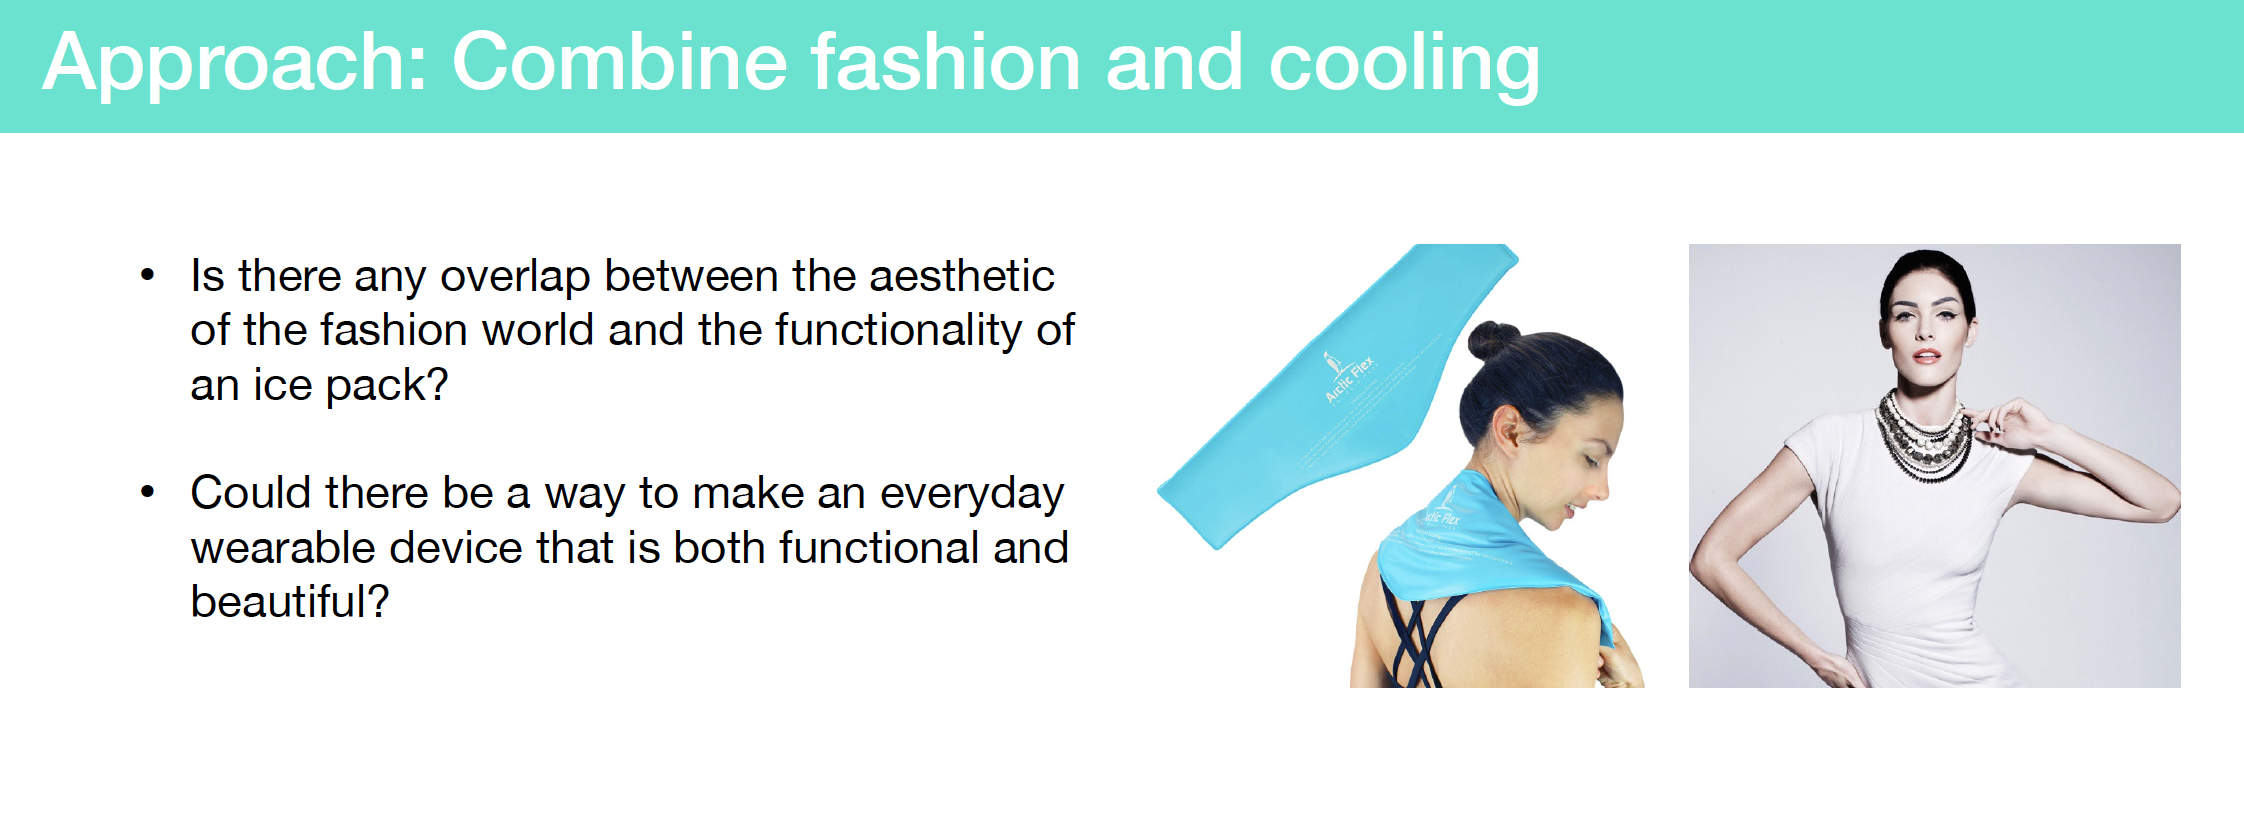
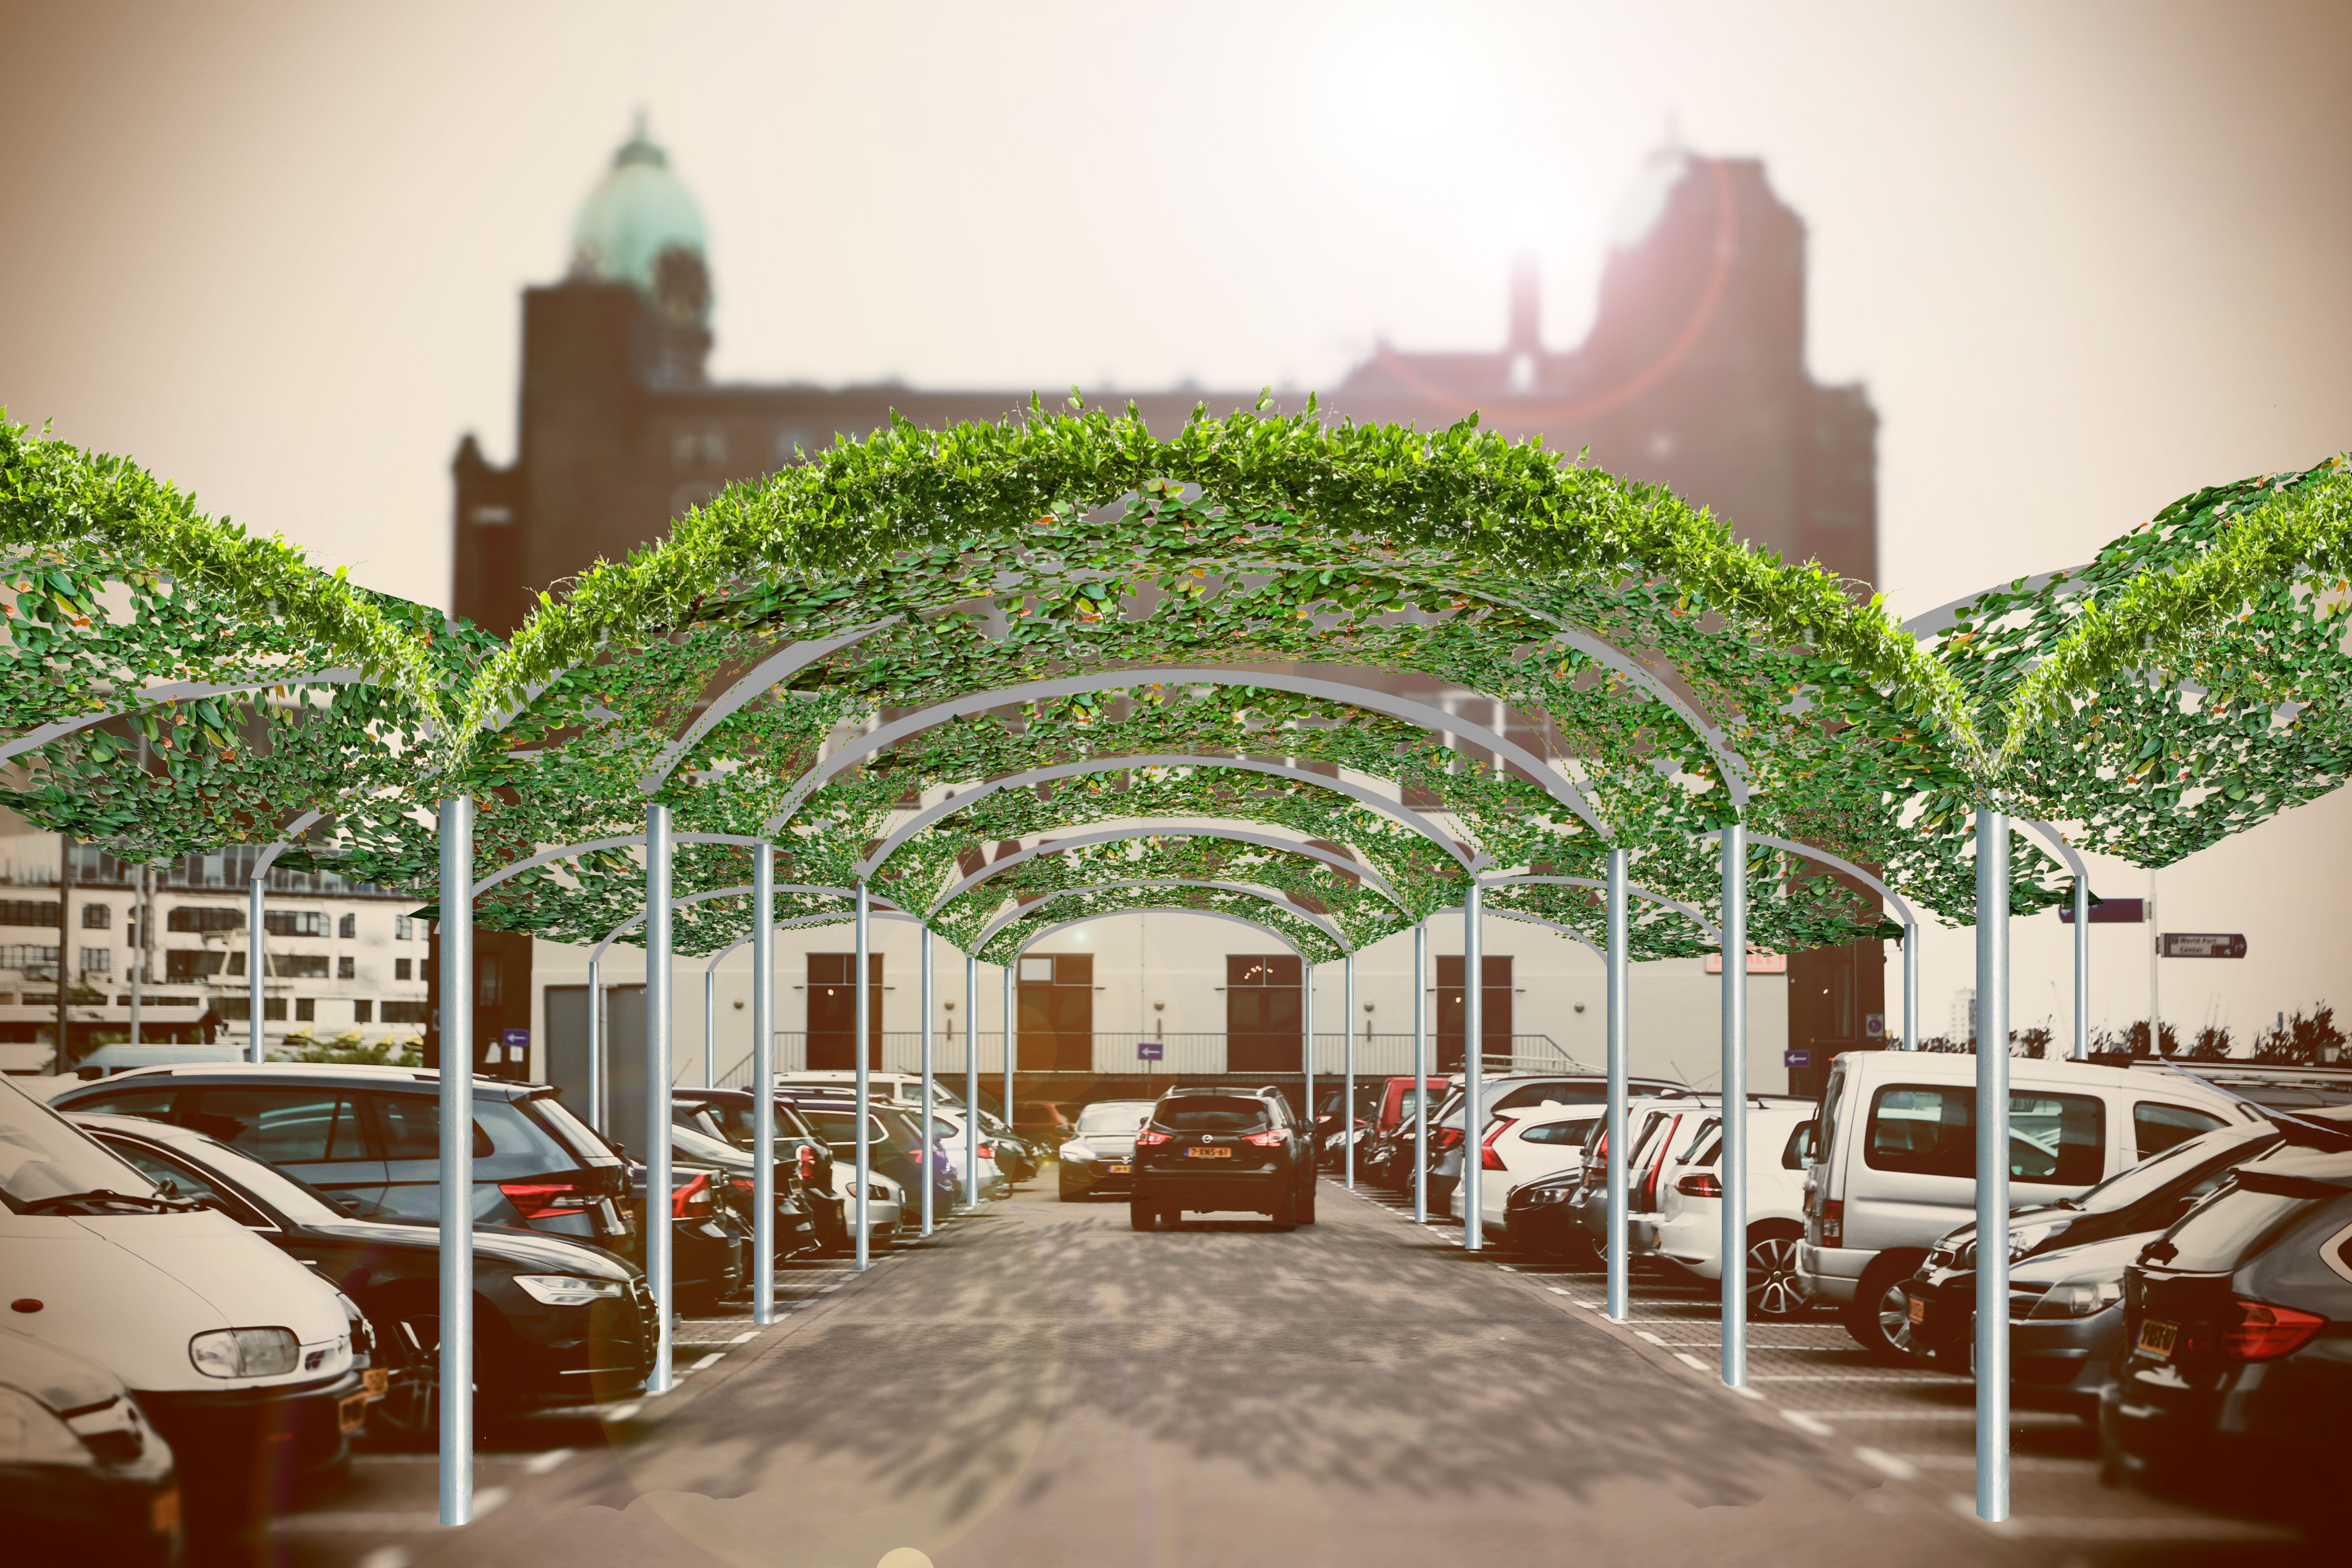
We need to have products that can help buildings, roads, and people stay cool without using enormous amounts of electricity to power air conditioning. Follow on with urban heat island investigation by thinking of products that help mitigate extreme heat. These could be personal cooling garments, greening for urban areas, or new kinds of shading or lightening surfaces.
Have a look at Hannah's design scope for a fashionable cooling garment that contains an ice-pack insert.

4. Pop up window
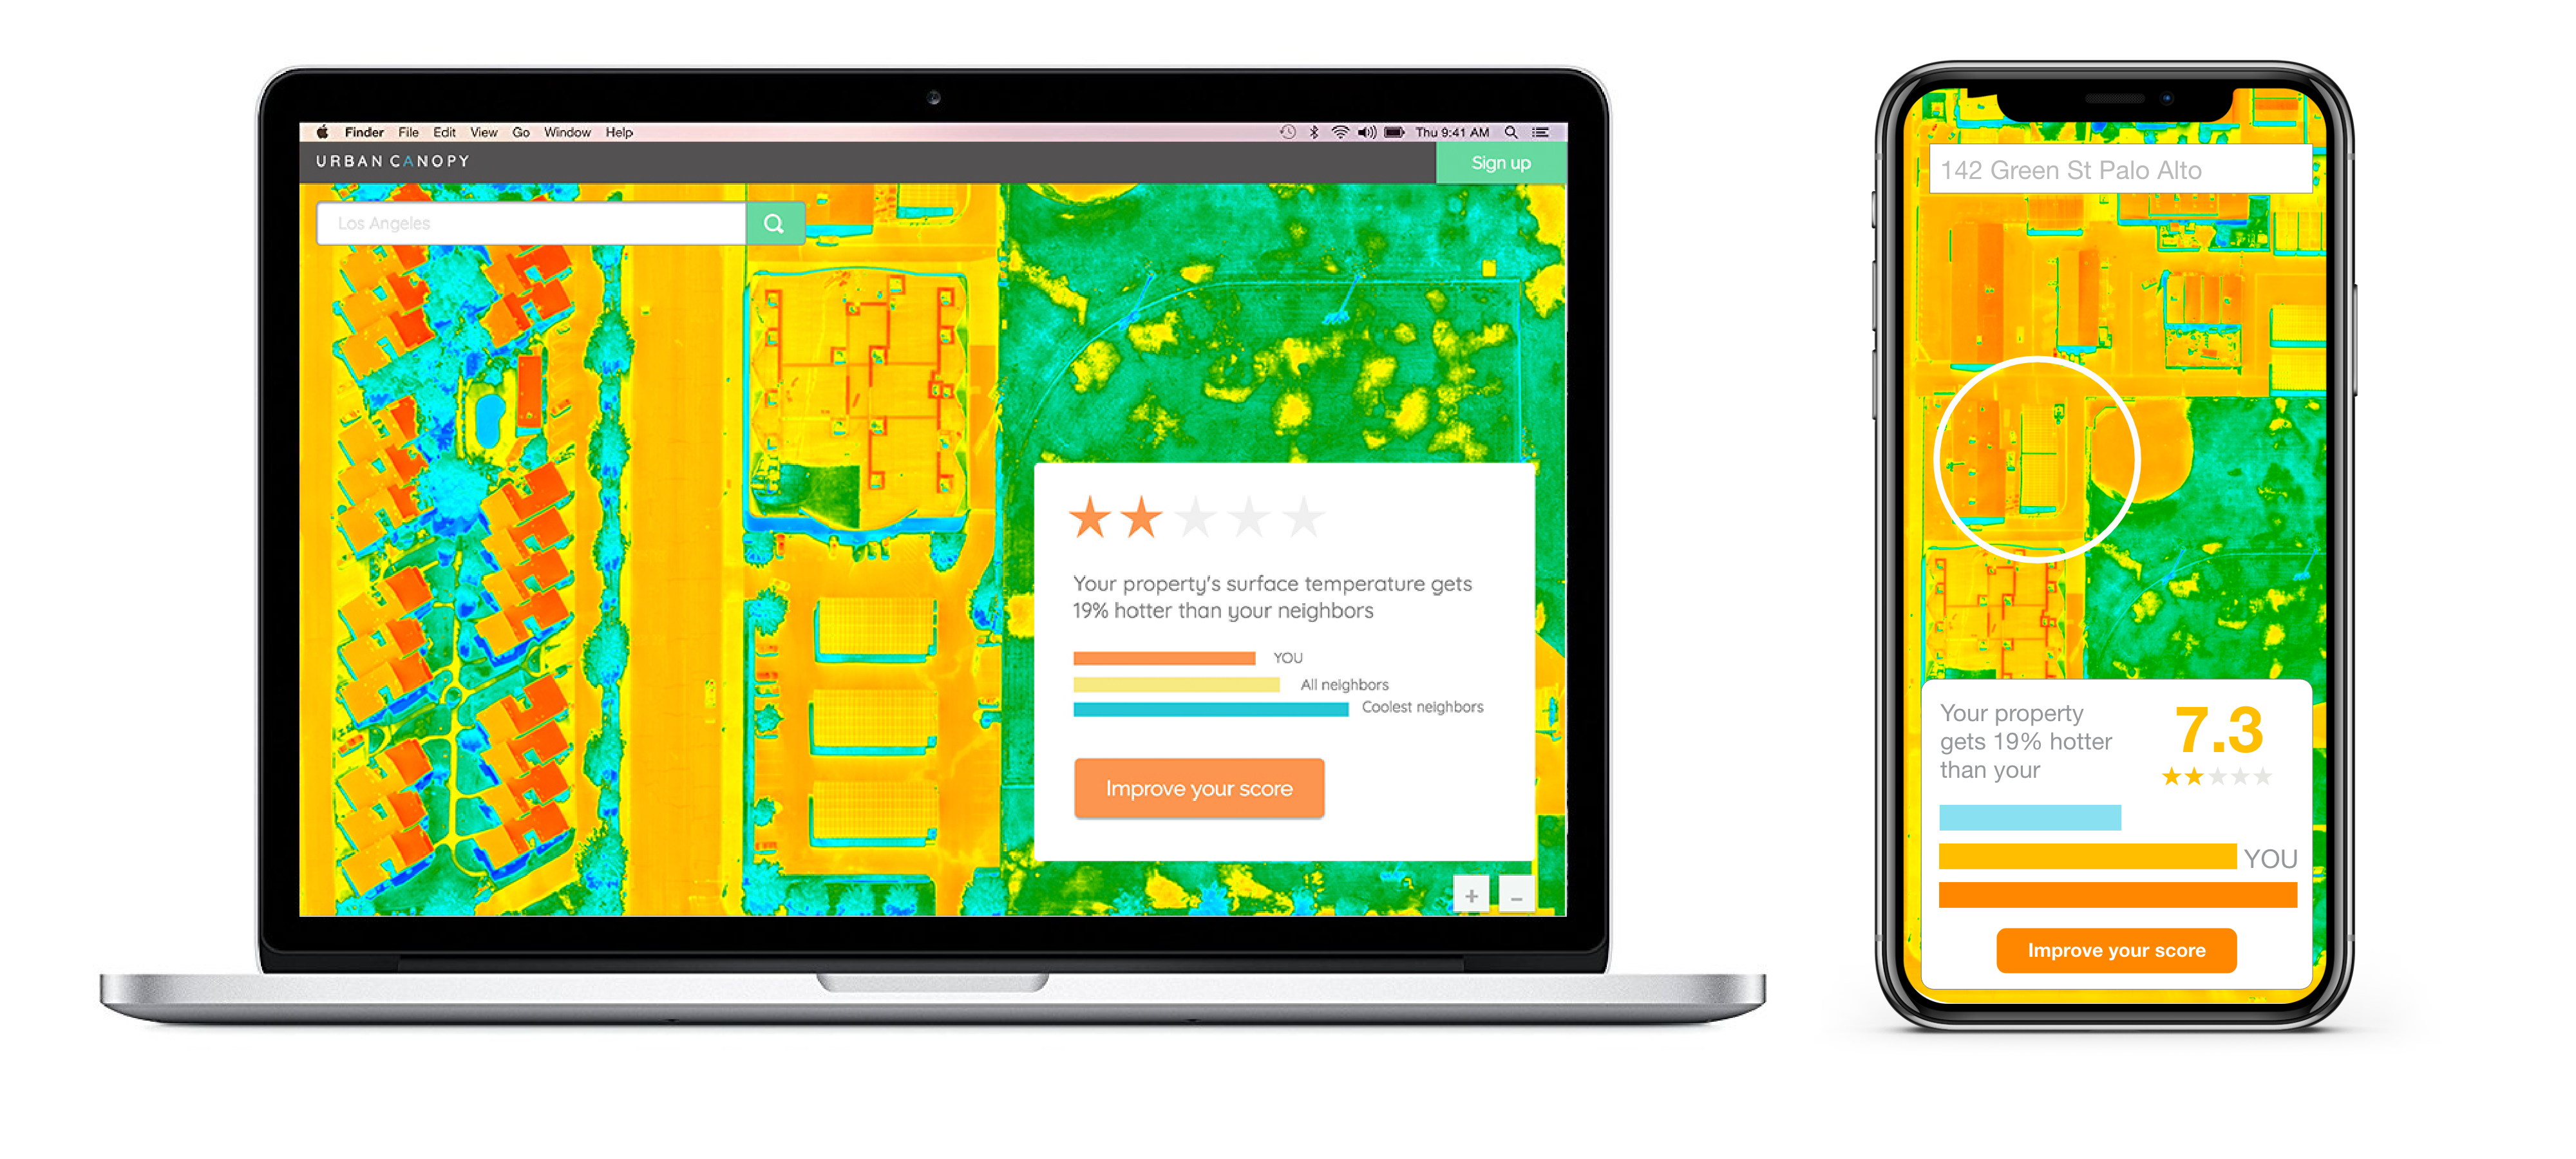
We'd like to add a feature to Urban Canopy to have a pop-up window show the thermal score for each land parcel. Then we can compare one property's temperature value against other properties. Mapbox has this feature available. Take a look into the documentation and see if we can build it.
5. Tell your urban heat island story
Data helps us tell a story about what is happening to our planet. But to change the world, we need to do more than just collecting data. We need to be able to convey the numbers in ways that communicate the data's meaning in a way that inspires people to take action. Even though this is a hackathon, this is where non-coding skills are critical. We need video-makers, graphic designers, data visualizers, story-tellers, writers, podcasters, and illustrators to convey the story of urban heat using their creative talents – and to use those stories to drive real, on-the-ground greening and cooling action in cities.
Here are some formats and mediums you can use communicate the story of urban heat islands:
> Youtube video. Here's a great example of an animated video about the problem with AC.
> Instagram slideshows of up to 10 images in post. Here's an example of one for cooking with less energy and one on environmental racism.
> Twitter video - under 2 mins videos with captions. You can use Wave.video to create these videos with captions. Here's an example of how the WEF does this.
> A podcast episode, as a narrative you write or you can interview an expert. We can publish your episode on Katie's How to Save the World podcast, or start your own podcast using Anchor.fm
> A blog, story, or tutorial post on Medium. Here's an example of one we did on urban heat islands.
> Illustrate a children's coloring page or exercise print out about urban heat islands. Have a look at these examples on Google search and try and add some scientific detail to the exercise.
> Social media graphics for Twitter and Instagram using Canva.
> A simple book using Blurb - it's easier than you think to make your own book!
> Urban cooling tips and actions - See the 27 tips to chose from here.
> Ebook - create a slideshow of images and text in Keynote and turn it into an ebook.
> Data visualization - extract an interesting data set from the images and tell a visual story. Beautiful News has great examples of simple data-driven story-telling.
> Poster - put the urban heat islands image on a poster and bring it to live with a message.
> Behavioral prompt - create a postcard, sticker, email message, social media poster prompting someone to take a specific urban cooling action. See the 27 actions people can take here.
We'll feature your content and stories on the Urban Canopy website, on Katie's social media of about 20,000 followers, and to our email list of 4,000 environmental practitioners.
Themes in Urban Heat To Explore
Urban heat is a fascinating topic to explore as a data scientist, content creator, designer, story-teller, or change-maker. There are many angles you can take and your stories can be backed up by stunning bright thermal images and interesting data. Here are the main themes to explore about how extreme urban heat harms us.
CO2 emissions from high AC use - Summer CO2 emissions in California jump up to twelve-fold on hot days when AC use is high. Increasing levels of urban heat, population, and urbanization will increase grid-produced CO2 emissions. See the data on California ISO and on Energy Lollipop.
Hospital admissions - Heat waves increase the load on hospitals. The California heat wave in 2006 caused 16,166 excess emergency department visits and cost hospitals $5.4 billion dollars. Reference + learn more.
GDP - Urban heat amplifies the economic costs of climate change by three fold, and is projected to reduce GPD by as much as 10.9 percent in some cities. Reference + learn more.
Violence & police - Violent crime increases proportionally to air temperature, adding to police budgets and increasing the likelihood of police violence incidents. Reference + learn more.
Racial justice - People of color and low income populations are effected disproportionately by urban heat. Over 700 people died in the 1995 Chicago heat wave, most of whom where African Americans. Reference + learn more.
Property values - Greenery increases property values. A study on Riverside County, California found that proximity to trees resulted in an increase of $16 million in total land value to the county. Tree cover increased property prices by 7 percent in residential areas and 18 percent for building lots. Reference + learn more.
Worker productivity - Heat reduces human productivity. A study on Indian garment workers showed worker productivity dropped 4 percent for every degree over 80 degrees Fahrenheit. Reference + learn more.
Electricity cost - The cost of electricity to run government buildings is three times higher in summer than in spring, and will continue to increase with rising electricity prices and warmer temperatures. The US loses $680 billion dollars a year to wasted electricity. Reference + learn more.
Grid upgrades - Increased load on the electricity grid, especially in summer, is accelerating the need for expensive grid upgrades. Aging grids drive $51B in annual utility distribution spending. US power grid outages have risen by 285% since records on blackouts began in 1984. Reference + learn more.
Sewer system - Lack of green infrastructure such as trees, parks, and green roofs increases rainfall runoff. This runoff pollutes waterways and causes excess load on the sewerage system. New York City's estimates to comply with sewer overflow orders will be more than $2 billion. Reference + learn more.
Air pollution - Heat increases the chemical reactions that create smog. In 2002, 288 million Americans were exposed to high ozone smog, which hastened death for 795 people, caused 4,150 hospitalizations, and cost $6.5 billion. Reference + learn more.
Vulnerable populations - The elderly, pregnant, and young are vulnerable to extreme heat. People over 65 make up most of the heat-related hospital visits and fatalities that occur during heat waves. Reference + learn more.
Questions & Feedback
Help us improve these instructions!
Ask questions on the Slack channel. We have mentors ready to help!
Please help us with any tips, feedback, and ways to improve the tutorial. Email katie at kp@helloworlde.com or message me on the Slack channel.